In the charts below, you’re essentially looking at a multi-timeframe imbalance map. The FVGs are stacked across TFs (timeframes) to show where price is inefficient and where it is likely to rebalance. The key is not just spotting them—but understanding which timeframe is in control and how they interact.
Let’s break it down precisely using the charts.
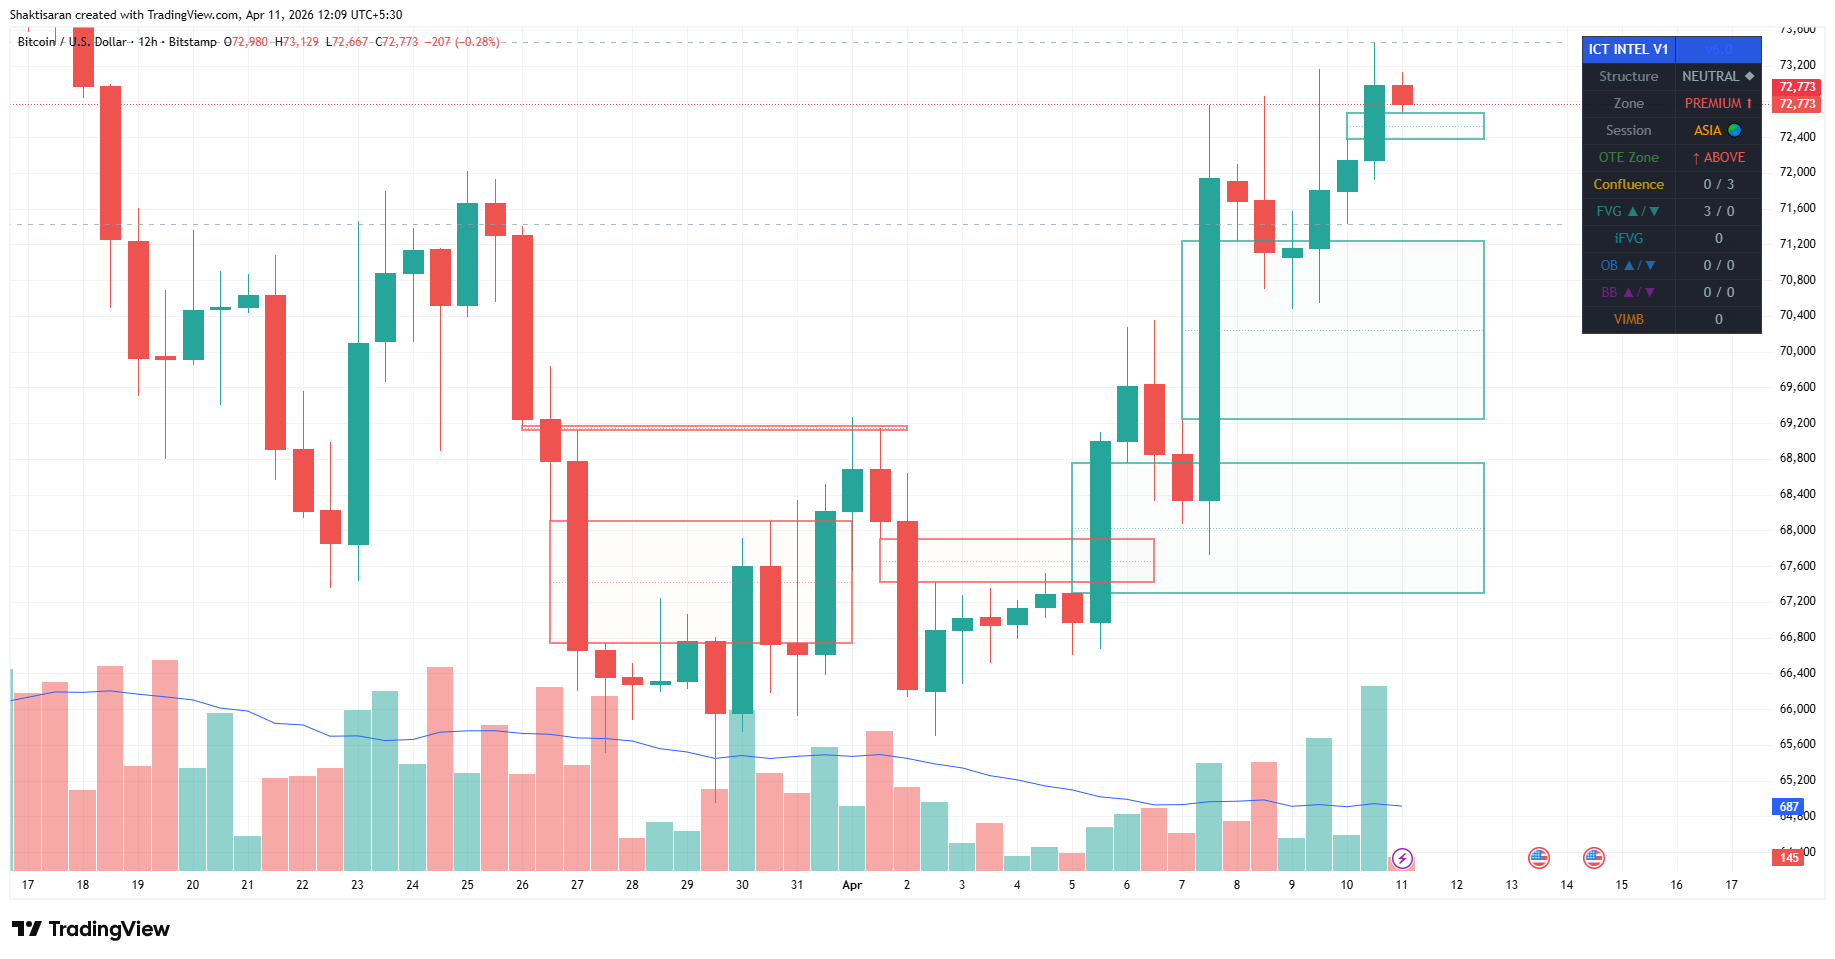
🔷 1. 12H FVG → Macro Delivery Map (Bias Engine)
What this chart shows:
- Price is in premium
- Multiple bullish FVGs below (3/0) → strong underlying demand
- Price recently expanded aggressively upward
Interpretation:
- 12H FVGs define macro inefficiency
- If below price → buy-side draw exists
- If above price → sell-side draw exists
👉 In this case:
- Market has already repriced upward
- Still holding inefficiencies below → supports bullish structure but expects pullbacks
Rule:
12H FVG = “Where price ultimately wants to rebalance”
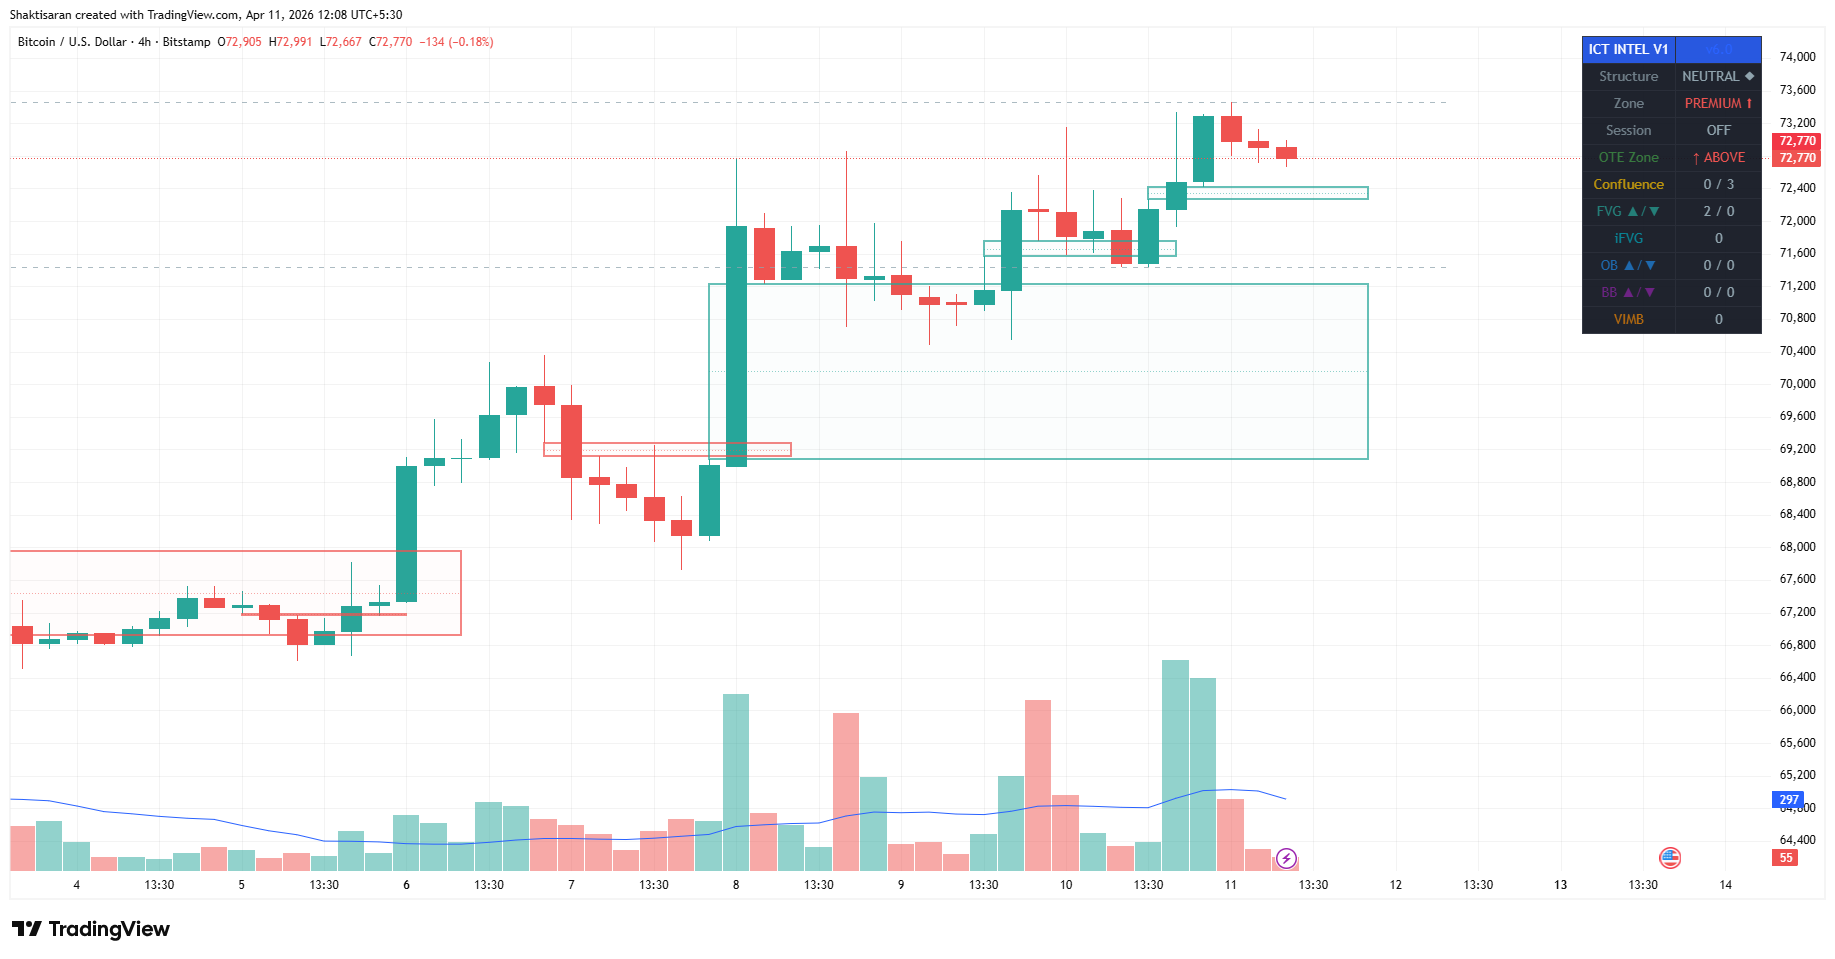
🔷 2. 4H FVG → Swing Control (Dealing Range Logic)
What this chart shows:
- Price in premium
- Large 4H bullish FVG below acting as base
- Smaller FVGs forming near current highs
Interpretation:
- 4H defines swing bias and dealing range
- Current state:
- Price extended into premium
- Likely behavior → mean reversion toward 4H imbalance
👉 Translation:
- Upside is weaker unless new displacement happens
- Downside = rebalancing into 4H FVG
Rule:
4H FVG = “Where swing pullback should go”
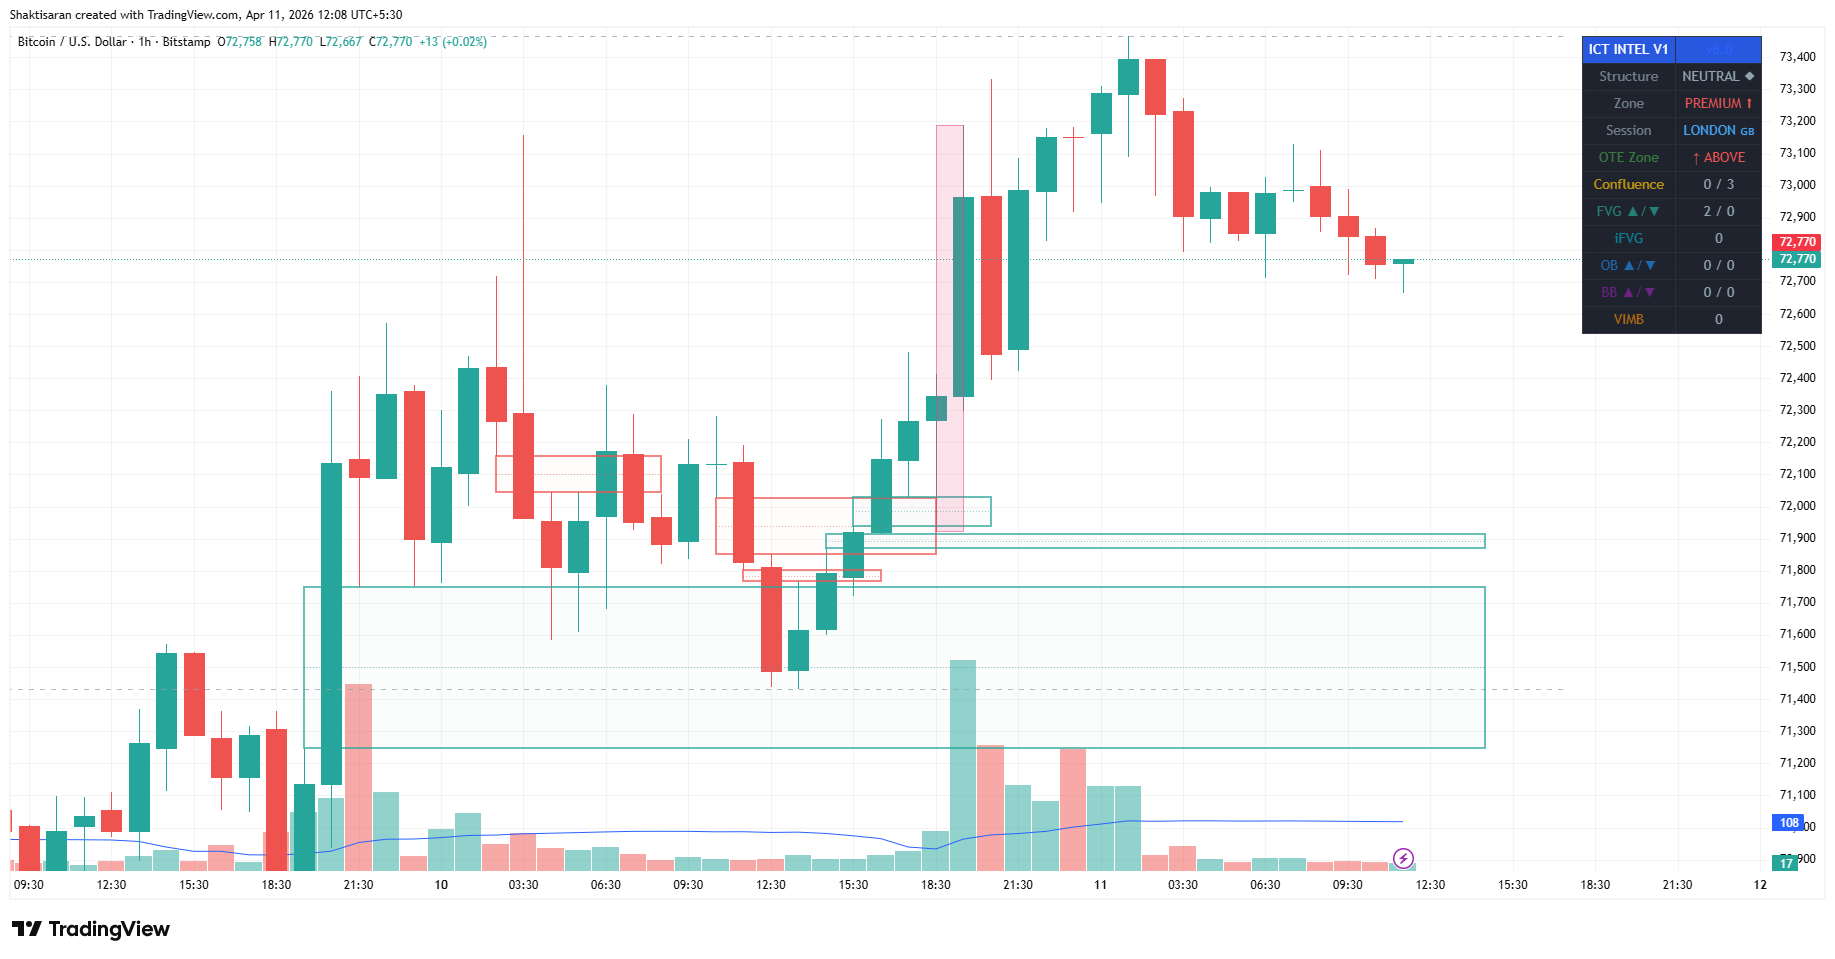
🔷 3. 1H FVG → Execution Zone Refinement
What this chart shows:
- Price sitting near 1H premium
- Some FVGs below partially filled
- No strong fresh displacement above
Interpretation:
- 1H tells you:
- Are we continuing?
- Or distributing before reversal?
👉 Current read:
- Weak follow-through after push
- Suggests:
- Either consolidation
- Or start of distribution → move lower
Rule:
1H FVG = “Are we continuing or preparing reversal?”
⚠️ Kill Zone
That tall red vertical shaded area (≈18:30–19:30) on the 1H chart is not an FVG. It’s a session/time-based highlight.
ICT-based models emphasize that:
Time is more important than price
Read my next article (coming soon) to learn about Kill Zone.
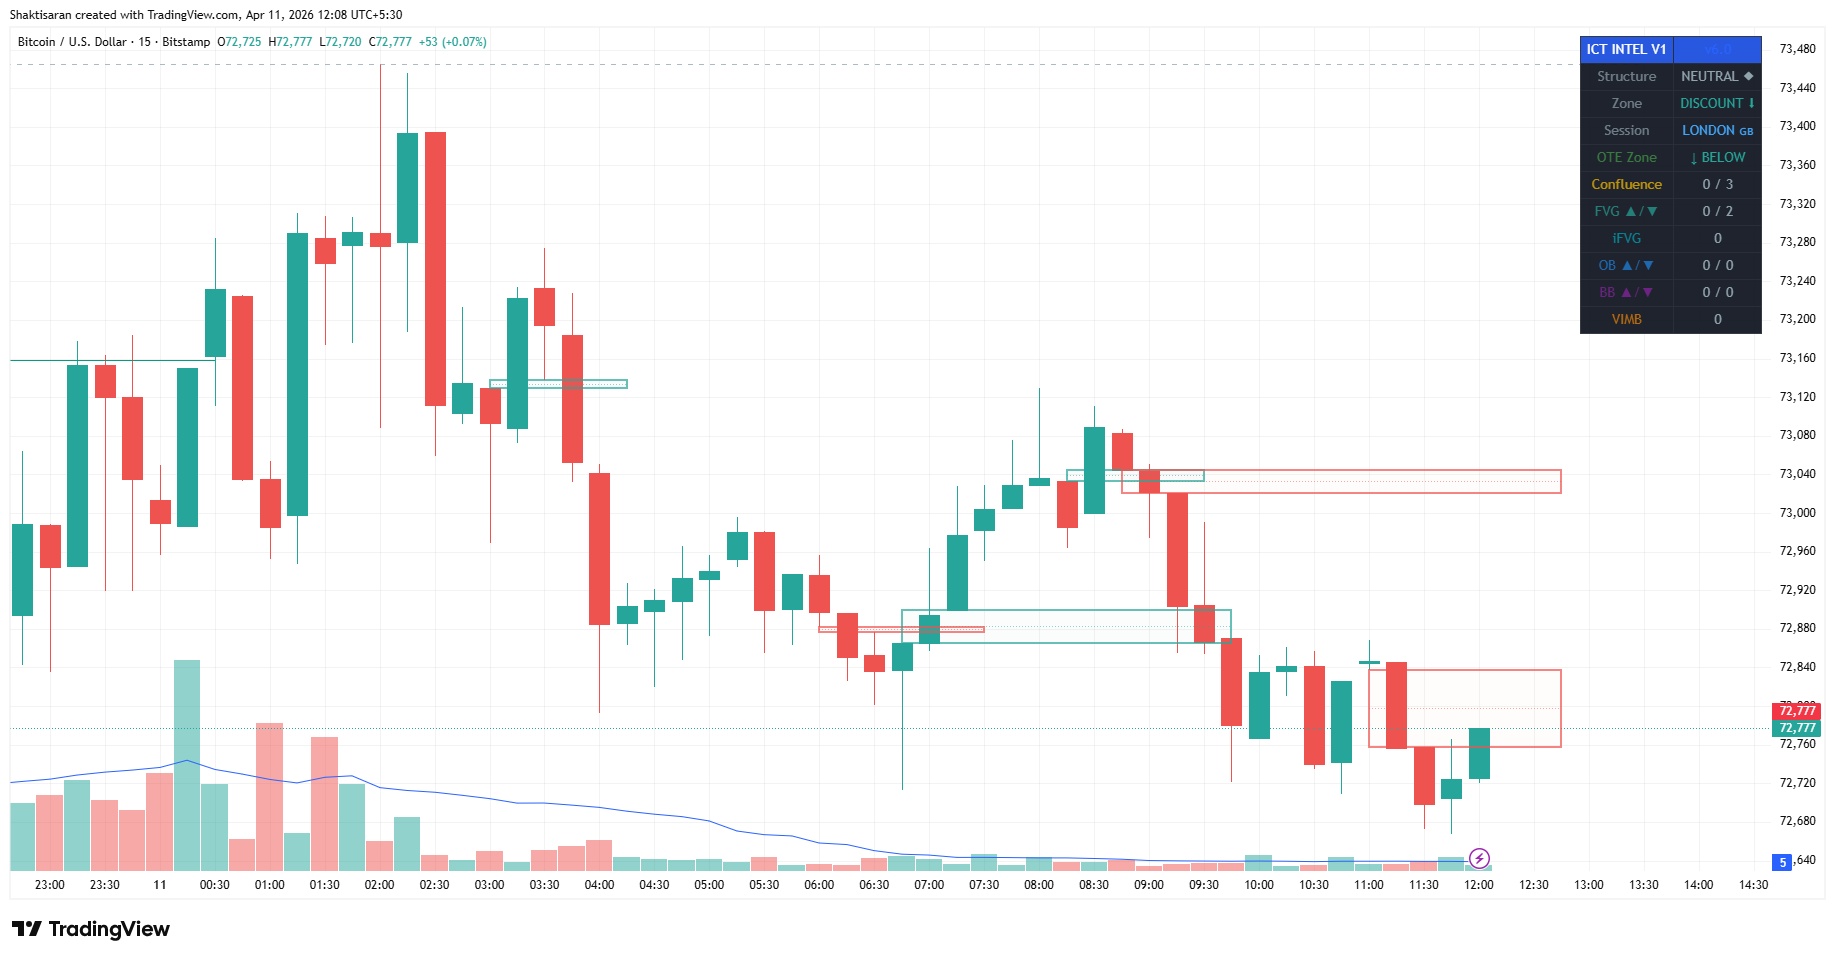
🔷 4. 15M FVG → Intraday Bias + Setup Formation
What this chart shows:
- Clear bearish FVG above
- Price reacting from it
- Lower highs forming after rejection
Interpretation:
- 15M shows intraday narrative
- Here:
- Price tapped supply (bearish FVG)
- Failed to continue up
- Shifted into sell-side delivery
👉 This is where bias flips intraday.
Rule:
15M FVG = “Where the trade idea is born”
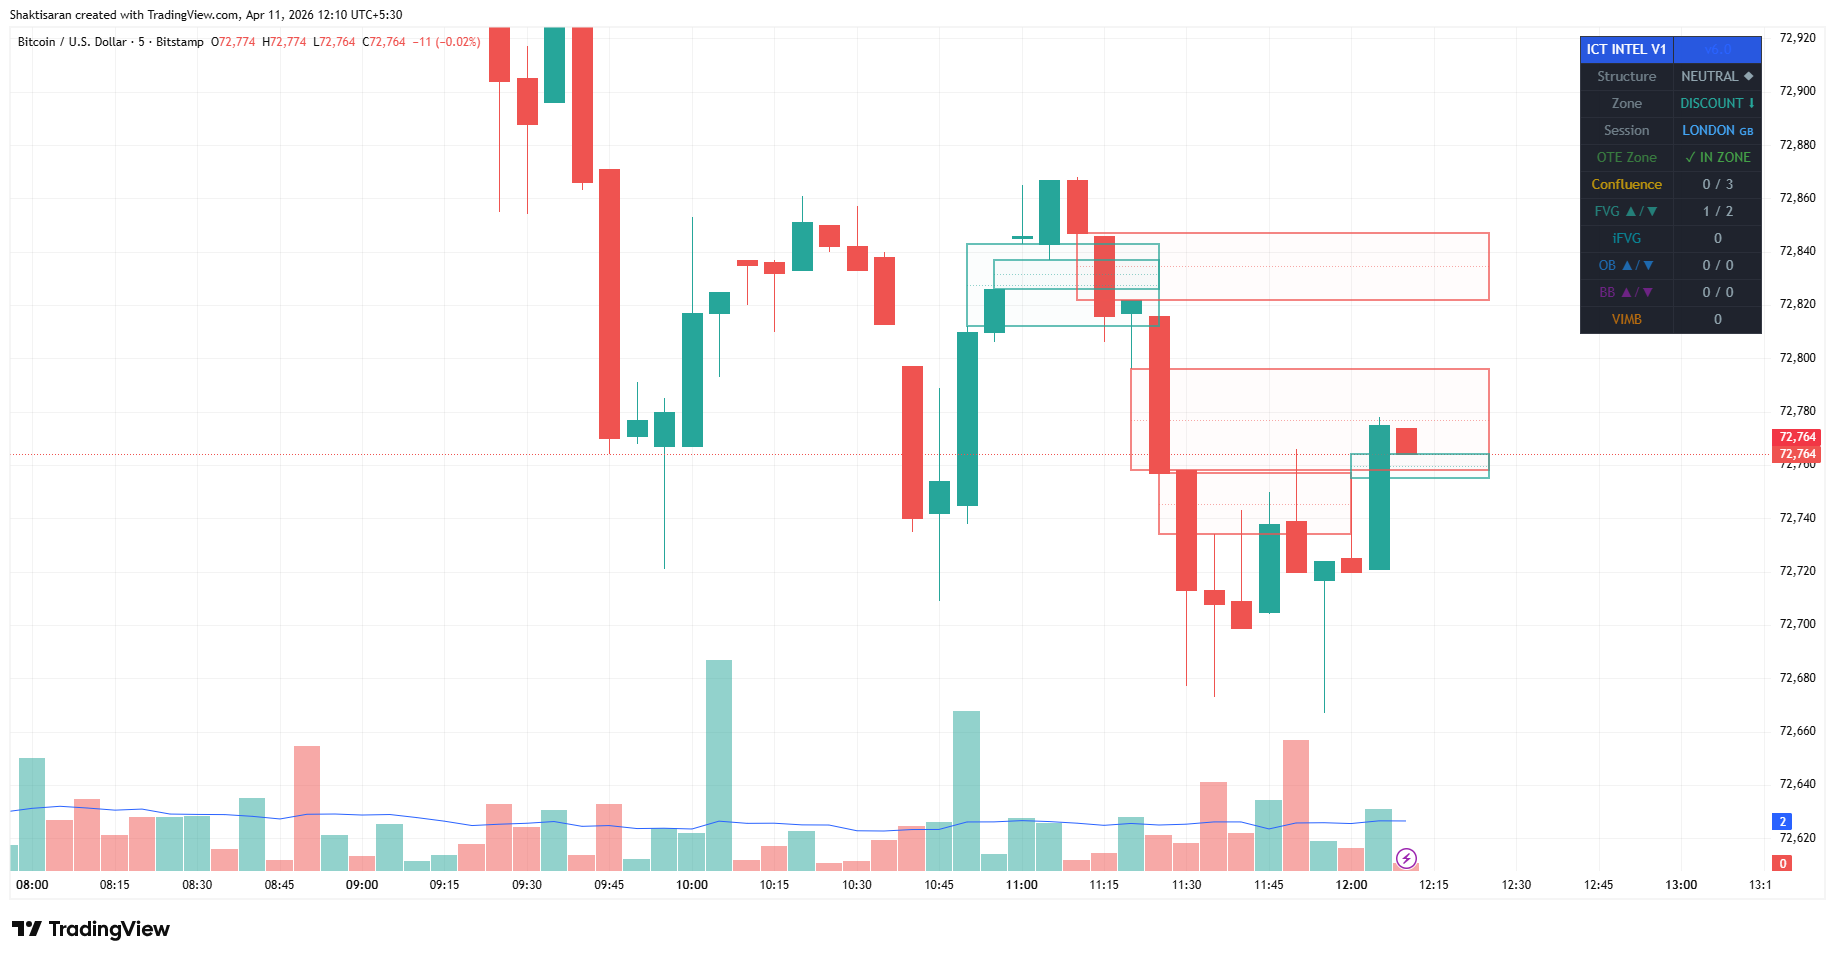
🔷 5. 5M FVG → Entry Precision (Trigger Layer)
What this chart shows:
- Local bearish FVG respected
- Small bullish FVG below acting as short-term support
- Choppy rebalancing behavior
Interpretation:
- 5M is execution only
- It does NOT define bias
- It tells you:
- Exact entry
- Stop placement
- Micro inefficiency
👉 Right now:
- Market is rebalancing after sell-off
- Not trending cleanly → lower probability unless aligned with HTF
Rule:
5M FVG = “Where you pull the trigger”
🔶 Putting It All Together (The Current Market State)
🔥 Hierarchy Alignment:
| TF | Signal |
| 12H | Bullish (but wants rebalance) |
| 4H | Premium → pullback likely |
| 1H | Weak continuation |
| 15M | Bearish shift |
| 5M | Choppy / rebalancing |
🧠 Real Insight (This is the edge)
👉 We are in a classic distribution → pullback phase
NOT trend continuation.
What that means:
- Upside trades = low probability
- Downside trades = mean reversion trades (not trend trades)
🎯 Practical Trading Playbook
✔ Shorts (Higher probability)
- Entry: 5M/15M bearish FVG
- Target:
- 1H FVG below
- 4H FVG below (main draw)
- Logic: Premium → Discount delivery
✔ Longs (Lower probability, tactical only)
- Only at:
- 1H / 4H FVG tap
- Confirmation:
- Strong displacement on 5M/15M
⚠️ Important Clarification
“If price goes through an FVG, is it invalid?”
Answer:
❌ No
✔ It becomes rebalanced / filled
- If price closes through it strongly → it’s no longer a reaction zone
- If price just wicks through → still valid
🧩 Final Mental Model
Think of FVGs like this:
- 12H / 4H → Destination
- 1H → Intent
- 15M → Setup
- 5M → Execution
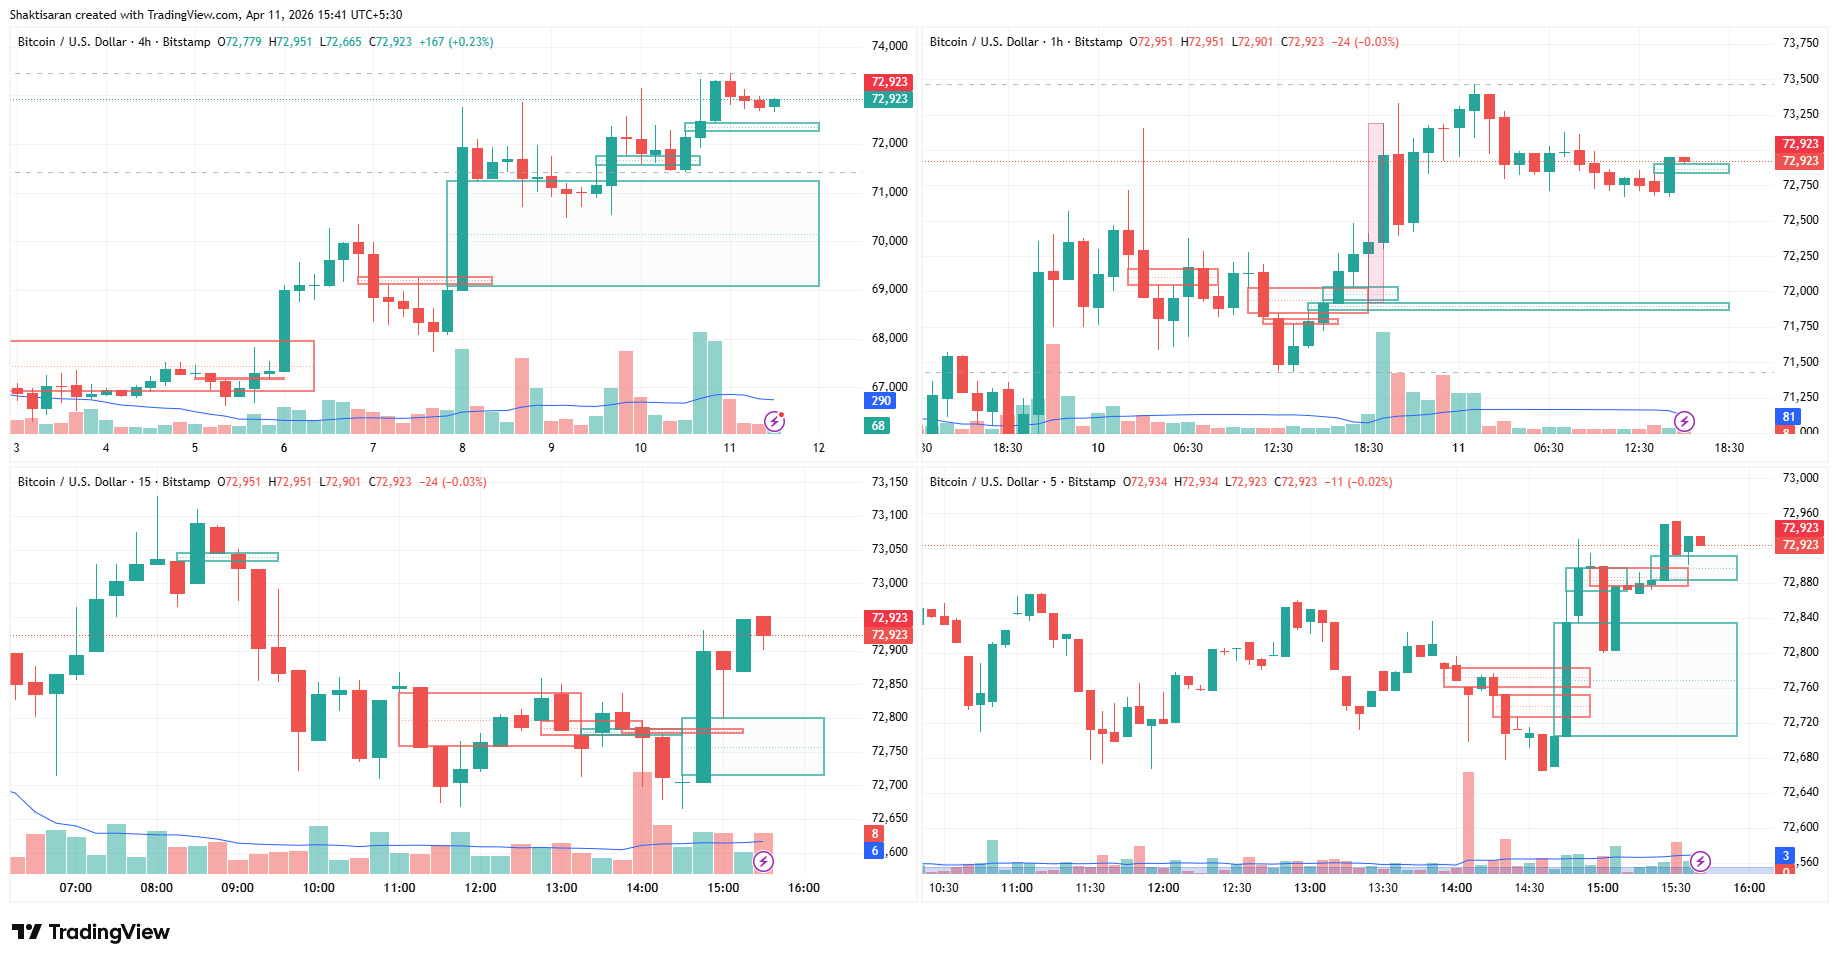
🔷 4 in 1 Chart Setup
Risk Disclaimer
Trading and investing in financial markets, including equity, derivatives, options, futures, and indices, involve substantial risk and may not be suitable for all investors.
The information provided on this website is for educational and informational purposes only and should not be considered as financial advice, investment advice, trading advice, or a recommendation to buy or sell any financial instrument.
Market conditions can change rapidly, and past performance is not indicative of future results. Losses can exceed initial capital, especially in leveraged products such as options and futures.
Readers are advised to:
Trade only with risk capital
Fully understand the risks involved
Use proper risk management techniques
Consult a SEBI-registered financial advisor before making any trading or investment decisions
The website owner, author, and contributors are not responsible for any financial losses incurred based on the information provided. All trading decisions are made at the reader’s own risk and discretion.