
Trading a major economic catalyst is not only about deciding whether price will go up or down.
Sometimes the more useful question is:
What if we do not know which direction will come first—and what if the market travels significantly in both directions?
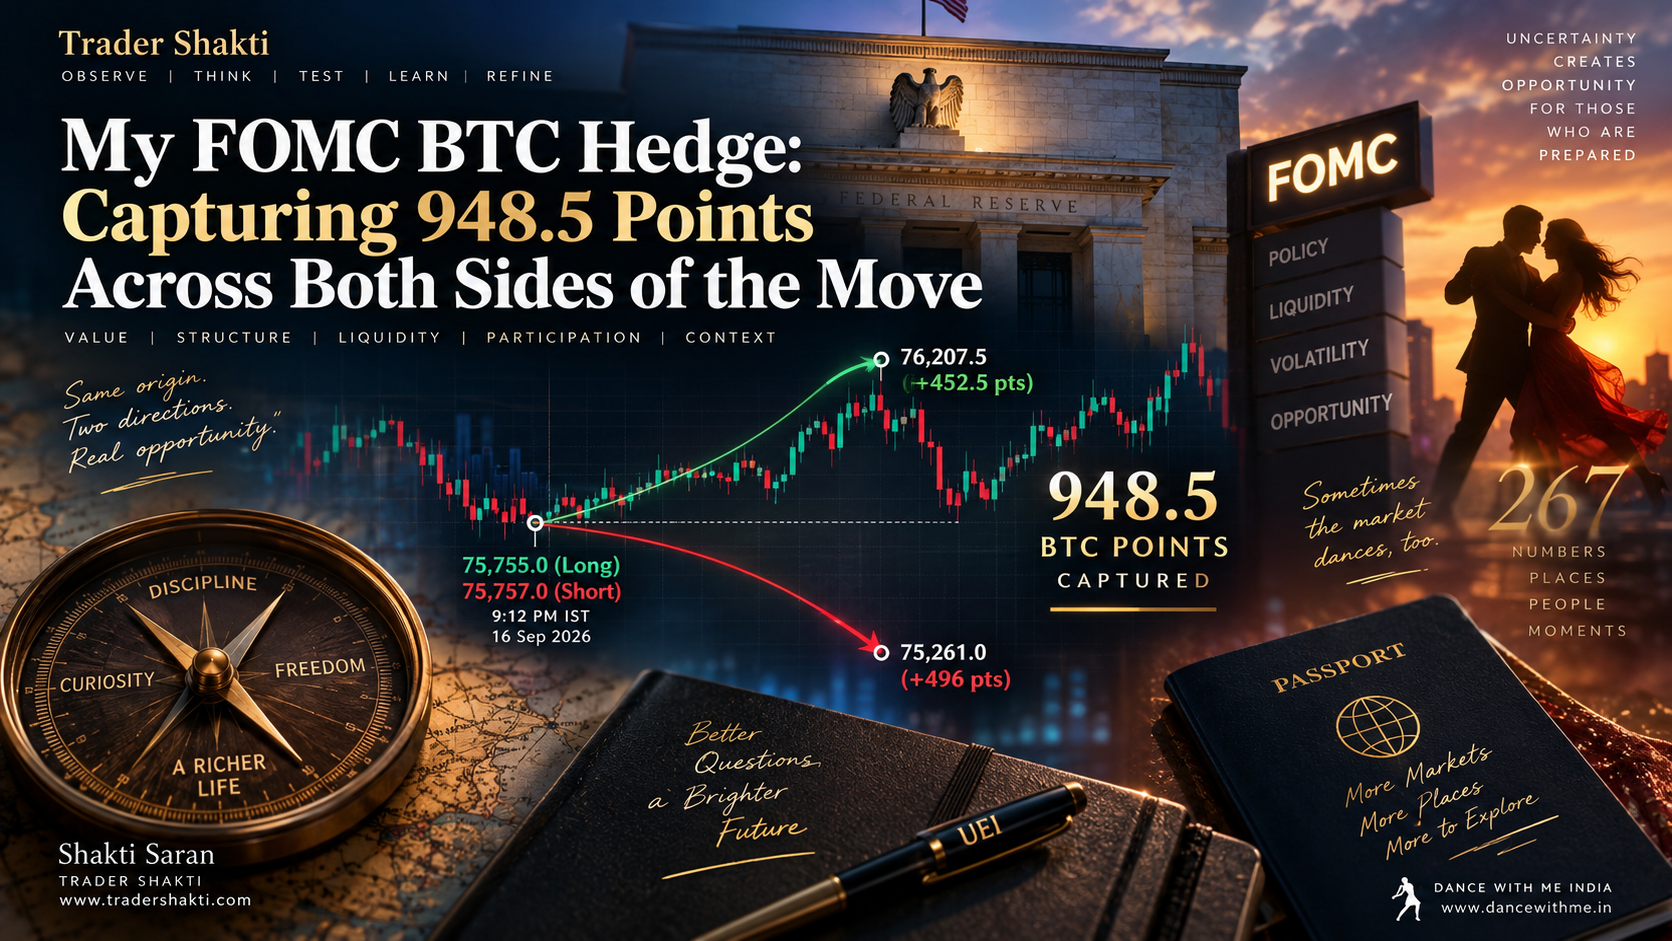
On September 16, 2026, ahead of the US Federal Reserve’s FOMC event, I decided to test a two-sided Bitcoin hedge around a carefully selected pre-event price area.
I opened a long and a short at almost exactly the same price.
By the time both trades were complete, I had captured:
Long: 452.5 BTC points
Short: 496 BTC points
Combined movement captured: 948.5 BTC points
But the 948.5 points were not the most important part of the trade.
What interested me much more was where to establish the hedge, why that particular area might provide a useful origin, how price behaved around it before and after the catalyst, and how each side of the hedge could be managed as the market revealed more information.
Why I Considered a Hedge Before FOMC
Major economic events can produce extremely fast and sometimes conflicting price movements.
Even when an expected policy outcome may already be substantially reflected in market pricing, the actual event can still produce multiple stages of reaction as participants respond to the announcement, positioning, liquidity, Treasury yields, the US dollar and other changing information.
Instead of requiring Bitcoin to follow one predetermined path, I was considering several possibilities.
Price could move higher first.
It could move lower first.
It could make a significant move in one direction and subsequently reverse.
Or the event could produce a genuine one-way repricing in which the previous trading area was abandoned altogether.
My objective was therefore not to predict the next candle.
I wanted to observe whether a carefully positioned hedge could allow me to participate in a wide two-sided auction if one developed.
The Most Important Decision: Where Should the Hedge Begin?
For me, this became one of the most interesting parts of the entire trade.
I did not want to establish the long and short at an arbitrary price simply because FOMC was approaching.
Before entering, I watched several consecutive 5-minute Bitcoin candles.
Price was repeatedly opening, closing and trading around a similar region within a relatively compact range.
Rather than immediately asking where Bitcoin would go next, I was interested in something more fundamental:
Where is price currently demonstrating acceptance?
I interpreted the repeated trading around this area as a form of pre-event accepted value or compression.
That led to the location from which I established the hedge.
At approximately 9:12 PM IST, my entries were:
Long: 75,755.0
Short: 75,757.0
The two entries were separated by only 2 BTC points.
The hedge therefore had a common origin around approximately 75,756.
This was important because I wasn’t merely trying to hedge direction.
I was trying to find a favorable origin from which uncertainty could be observed and managed.
Price Location and Time Location
There was another dimension to the decision.
I also did not want to establish the hedge too far ahead of FOMC.
If I entered many hours earlier, Bitcoin could undergo a substantial unrelated move before the catalyst. But if I waited until the final moments before the announcement, pre-event volatility could already be expanding and execution conditions could change quickly.
The hedge was established at approximately 9:12 PM IST, a little over two hours before the scheduled FOMC event.
This gave me another idea that I would like to study further:
Hedge-Origin Quality = Price-Location Quality × Time-Location Quality
Price-location quality asks whether the hedge is being established around a meaningful area of recent market acceptance rather than an arbitrary price.
Time-location quality asks whether the hedge is being established sufficiently close to the catalyst for that accepted-value area to remain relevant, while still allowing execution before event volatility becomes dominant.
Neither of these guarantees that price will return to the hedge origin.
A major catalyst can establish entirely new value and leave the previous area behind.
That failure case is extremely important.
But it gives me something measurable to investigate across future events.
An Opportunity Before FOMC: Could the Hedge Have Been Adaptive?
Before FOMC, Bitcoin also moved lower during the period around the House SBRM meeting.
That gave the short side of my hedge an opportunity to become profitable before the main catalyst.
I kept the hedge intact.
Looking back afterward, however, this created an interesting research question.
I had already been considering a possible market path in which Bitcoin might move toward buyside liquidity before a potentially larger decline around FOMC.
If that scenario developed, another approach could have been:
Establish hedge → price moves lower → harvest the profitable short → retain the long → price subsequently moves higher toward buyside liquidity → reassess the market → re-establish a short from a better location only if a new short independently qualifies.
This would effectively transform a static hedge into an adaptive hedge.
But hindsight makes such sequences look much easier than they are.
Suppose I had harvested the original short during the earlier decline and Bitcoin had simply continued falling.
The anticipated move toward buyside liquidity might never have happened.
I could then have lost a well-positioned short while waiting for a re-entry that the market never offered.
So my conclusion is not:
“I should have closed the short and re-entered higher.”
The useful conclusion is:
“This is another hypothesis worth testing.”
Every re-entry should have to qualify as a new trade based on the evidence available at that time. Otherwise, adaptive hedging could easily become another name for overtrading.
Then FOMC Arrived
When FOMC arrived, volatility expanded dramatically.
Bitcoin produced exactly the kind of two-sided movement that made the hedge experiment interesting.
Price moved sharply, reversed and subsequently travelled substantially through and away from the area where the hedge had originated.
Rather than immediately deciding that the first event move had revealed the final direction, I continued observing the developing battlefield through price structure, liquidity, participation and changing market behaviour.
This reflects an important principle in how I am learning to approach markets:
I don’t try to decide what the market must do. I try to understand what the market is doing and what changes.

Harvesting the Long: +452.5 BTC Points
Following the FOMC volatility, Bitcoin made a strong upside move.
I continued observing the move while the upside expansion remained active and eventually saw a rejection that I considered sufficient to harvest the long.
My execution was:
Long Entry: 75,755.0
Long Exit: 76,207.5
BTC Movement Captured: 452.5 points
At that moment, something fundamental changed.
Until the long was closed, I had been holding a two-sided hedge.
Once I harvested the long, the remaining short was no longer protected by an opposing position.
It had become an independent directional exposure.
That means the remaining trade had to be evaluated according to the market conditions that existed then, rather than according to the reasoning that originally justified the hedge.
This distinction seems simple, but I think it is extremely important:
When one side of a hedge is harvested, the state of the trade changes.

The Remaining Short
My original short entry was:
75,757.0
Following the upside FOMC excursion, Bitcoin eventually began moving lower again.
I had already mapped several important price levels on my execution chart.
This proved particularly useful because my execution environment is deliberately much simpler than the multiple charts and indicators I use for analysis.
Instead of trying to reproduce every piece of analytical information on the execution screen, I had a smaller set of actionable levels available while price was moving quickly.
One of my planned short targets was approximately:
75,501.5
As Bitcoin moved toward it, another question became increasingly relevant.
Does Price Have to Reach the Exact Liquidity Level?
I had also been studying liquidity below the market.
But a liquidity area is a potential destination—not an obligation.
Price can reverse before reaching it.
It can approach it and be front-run.
It can partially consume liquidity.
It can sweep the area and reverse.
Or it can move directly through it and continue much further.
This made me think about another concept that I would like to study systematically:
How much of the journey toward a mapped liquidity objective should we actually try to capture?
Perhaps in some circumstances the efficient decision is to capture 70%, 80% or 90% of the available distance rather than demanding the final few points.
In other circumstances, structure and participation may remain sufficiently strong to justify continuing beyond an earlier target.
The important question may therefore not be:
“Will price reach the liquidity?”
A more useful question could be:
“How much additional expected value remains in pursuing the final part of the move?”
Cancelling My TP—but Remaining Ready to Exit
As Bitcoin approached my planned short TP around 75,501.5, I was actively watching the move.
Instead of simply allowing the fixed target to determine the outcome, I cancelled the TP.
But I did not cancel it so that I could passively hope for a larger profit.
I moved my mouse to the position-close control and remained prepared to exit manually.
In other words, I replaced a predefined price-based exit with active discretionary protection while continuing to observe the market.
Price continued moving lower.
Eventually, I observed enough rejection to close the position manually at:
Short Entry: 75,757.0
Short Exit: 75,261.0
BTC Movement Captured: 496 points
Compared with the original target around 75,501.5, active management allowed me to capture approximately another:
240.5 BTC points
of the downside move.
This does not mean that cancelling a TP when price reaches it is automatically a good strategy.
Doing that without a clear management process can turn a disciplined trade into an uncontrolled one.
The more transferable idea for me is:
Protected target → price approaches objective → continuation remains healthy → switch to active management → remain prepared to protect the trade immediately → continue only while the evidence supports continuation → exit when meaningful rejection develops.
948.5 BTC Points Across Both Sides
The completed trades were:
LONG TRADE Entry: 75,755.0 Exit: 76,207.5 BTC Movement Captured: +452.5 points
SHORT TRADE Entry: 75,757.0 Exit: 75,261.0 BTC Movement Captured: +496 points
COMBINED BTC MOVEMENT CAPTURED: 948.5 POINTS
Note: These figures refer to BTC price movement captured between entry and exit, not monetary profit or position size.
What interests me most is that the 948.5 points came from two opposing movements originating from almost exactly the same initial price area.
That brings me back to the original question of hedge-origin quality.
From Static Hedging to Adaptive Hedging
This experiment also gave me a framework for thinking about two different approaches.
A static hedge might look approximately like:
Establish both legs → observe catalyst → harvest one leg → manage remaining exposure → exit.
An adaptive hedge could potentially become:
Establish both legs → observe pre-event excursion → harvest qualifying leg → reassess → potentially rebuild harvested leg from a better location → observe catalyst → continue managing changing exposure.
The adaptive version potentially extracts more information—and perhaps more opportunity—from the path price takes.
It also introduces considerably more opportunities to make mistakes.
A trader can harvest too early.
A better re-entry may never appear.
The market can establish new value rather than returning to old value.
Additional transactions introduce additional costs.
And a trader can begin seeing “opportunities” simply because they want to keep adjusting the hedge.
For that reason, I think every transition needs evidence.
Value First, Direction Second
One of my strongest takeaways from this trade is something that had already been becoming increasingly important in my trading:
Value and compression first.
Before worrying about where Bitcoin might go, I spent time observing where it was currently comfortable trading.
The hedge was then established around that accepted area.
FOMC disrupted the equilibrium.
From there, I could observe how price behaved as it moved away from the origin, crossed previous territory, attacked new areas and eventually moved in both directions.
This is very different from beginning with:
“Bitcoin is going up.”
or:
“Bitcoin is going down.”
Instead, the process becomes:
Where is value?
Where is structure?
Where is liquidity?
Who appears to be participating?
What territory is being attacked?
Is price being accepted or rejected?
What has changed since the previous observation?
Direction becomes an outcome of understanding rather than the starting assumption.
A Personal 267 Coincidence Along the Way
There was also a small personal coincidence in the trade that made me smile.
My birthday is 26 July — 26/7 — and over the years I have occasionally shared interesting appearances and repetitions of numbers that happen to catch my attention.
Earlier that day, I had wished my social dancing teacher a happy birthday on her Instagram post.
Some time later, after observing the market and deciding to exit my profitable BTC long, my market order happened to execute at:
76,207.5
And there it was again: 267.
The number had nothing to do with my decision to exit the trade. I had already made that decision based entirely on the market behaviour I was observing. I noticed the familiar sequence only after the order had been executed and simply enjoyed the coincidence.
I simply noticed the familiar sequence afterward and enjoyed the coincidence.
It felt especially fitting on a day when dancing had already crossed my mind.
I enjoy social dancing, including Salsa, Bachata and Kizomba. Dancing and trading are obviously very different activities, but I find something fascinating in both: observation, timing, balance, adaptation and responding to changing movement.
In partner dancing, two people continuously observe and respond to one another through movement and timing.
In a market, I am certainly not dancing with another individual on the other side of my screen, and the market is not responding specifically to me. But there is something enjoyable about learning to observe movement without trying to force it.
Among my various projects, I also created Dance With Me India:
The platform helps people discover dance schools, studios, teachers, choreographers, artists, classes, courses, events, parties, products and services related to dance.
So perhaps 76,207.5 is simply one more little 267 coincidence to add to my collection. 😊
A Curious Postscript: Numb3rs, July and the 26th
After completing both trades, the market experiment was over for me. Some time later, while having dinner, I started watching Numb3rs Season 6, Episode 12. The episode originally aired many years ago, but I only started watching the series earlier this year on Hotstar.
Earlier that day, I had already noticed the rather amusing 267 coincidence connecting my 26 July (26/7) birthday with my BTC long market execution at 76,207.5.
Then, completely separately, the episode I happened to watch included a conversation about a wedding date. First came a reference to the last week of July—and moments later, specifically, the 26th.
I had to smile. 😊
Of course, none of this had anything to do with my trading decisions or market analysis. The trades had already been completed. It was simply one of those curious coincidences that becomes especially noticeable because of its timing.
I’ve written about many television shows and episodes over the years, so perhaps this was a fitting little postscript to an already memorable evening.
The Result Is Interesting. The Questions Are More Valuable.
Capturing 948.5 BTC points across the two opposing positions was certainly satisfying.
But one successful trade does not establish that this approach will work consistently.
There are many ways the same experiment could have developed differently.
Bitcoin could have repriced strongly in one direction and never returned.
The original accepted-value area could have become completely irrelevant after FOMC.
I could have harvested one side too early.
The remaining position could have continued adversely.
An attempted adaptive re-entry could have failed.
Liquidity could have behaved differently.
The manual extension beyond my original TP could have surrendered part of an already successful trade.
These are not inconvenient exceptions to the idea.
They are part of the research.
That is why I see this trade not as proof of a formula, but as a useful real-world experiment that generated several questions worth studying further:
How should pre-catalyst accepted value be measured?
How narrow and persistent should compression be before it becomes meaningful?
How stable is the center of value?
How close to a catalyst should a hedge be established?
How frequently does price revisit its pre-event origin after a major catalyst?
When does old value remain relevant, and when is it permanently abandoned?
Can pre-event hedge legs be harvested and rebuilt without degrading the protection the hedge was designed to provide?
How should liquidity-distance capture be managed?
And how should all of these relationships change across different volatility, liquidity, macro and market-structure regimes?
These are much more interesting questions to me than simply asking whether the next Bitcoin candle will be green or red.
Understanding Before Prediction
The more I trade, the less interested I become in trying to predict exactly what the market will do.
Markets contain enormous numbers of participants, strategies, time horizons, information flows and changing conditions.
I don’t believe I can know the future path with certainty.
What I can try to do is improve my understanding of the present.
Understand the battlefield.
Observe the participants and resources.
Map important territories.
Construct possible scenarios without becoming attached to any one of them.
Watch what the market actually does.
Act when the evidence becomes sufficient.
Reassess when the evidence changes.
This FOMC hedge began around an area where Bitcoin appeared to be repeatedly accepting value.
From almost the same origin, the subsequent market eventually allowed me to capture 452.5 points on the long side and 496 points on the short side—a combined 948.5 BTC points of price movement.
That result was enjoyable.
But what I want to carry forward is not the expectation that the next FOMC will behave the same way.
It is the process that produced new things to understand.
Observe. Think. Test. Learn. Remember. Refine.
And then return to the market with better questions.
Shakti Saran
— Trader Shakti
www.tradershakti.com
I am not a financial advisor or certified trading professional. Trader Shakti shares my personal trading experiences, observations and reflections for educational, informational and motivational purposes.
Disclaimer
The information provided in this article and on Trader Shakti is for educational and informational purposes only. It does not constitute financial, investment or trading advice, or a recommendation to buy, sell or hold any financial instrument or digital asset.
Any trades, market observations, strategies or examples discussed are shared only as historical or educational illustrations. They should not be considered predictions, trading signals or representations of future performance.
Past performance does not guarantee future results. Market conditions can change rapidly, and no trading method, analysis or strategy can eliminate the risk of loss.
Risk Disclaimer
Trading and investing in financial markets—including equities, cryptocurrencies, derivatives, options, futures and indices—involve substantial risk and may not be suitable for all investors.
Leveraged products can magnify both gains and losses, and in some circumstances losses may exceed the amount initially committed.
Readers should:
- Trade or invest only with risk capital they can afford to lose
- Fully understand the instruments and risks involved
- Use appropriate position sizing and risk-management techniques
- Conduct their own independent research and analysis
- Consider their financial circumstances, objectives and risk tolerance
- Seek advice from an appropriately qualified or SEBI-registered financial advisor, where applicable, before making financial or investment decisions
The website owner, author and contributors are not responsible for financial losses or other consequences arising from decisions made on the basis of information published on this website. All trading and investment decisions remain the reader’s own responsibility and are made at their own risk and discretion.