
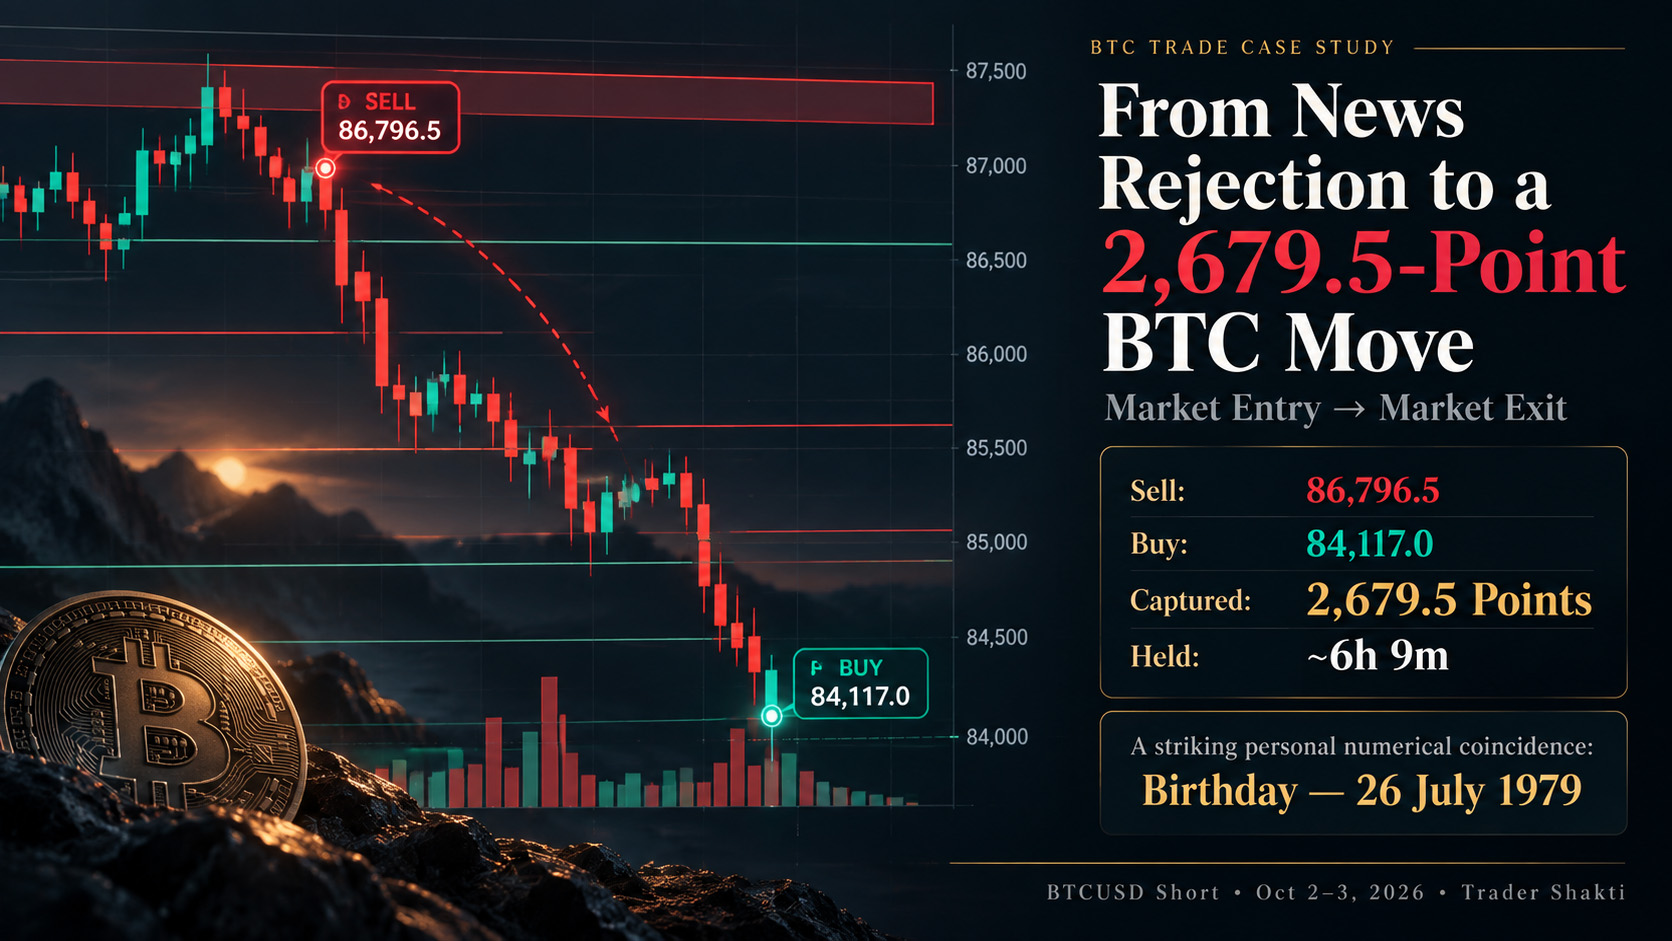
On October 2, 2026, I entered a short position in Bitcoin shortly after the 6:00 PM IST scheduled market event.
My market sell was filled at:
BTCUSD Short Entry: $86,796.5 at 6:01:47 PM IST
Several hours later, after Bitcoin had fallen substantially and bounced from the day’s low, I closed the position at:
BTCUSD Market Exit: $84,117.0 at 12:10:40 AM IST on October 3
The difference between my actual market entry and actual market exit was:
86,796.5 − 84,117.0 = 2,679.5 BTC points
The position had remained open for a little over six hours.

Actual Trade Entry & Exit
What interested me most about this trade was not simply the number of points captured. The trade developed into something much closer to a larger market journey than the relatively short tactical trades I usually take.
It also became a valuable live case study for some of the concepts I have been studying through my UEI indicators and the broader research framework I currently call the Unknown System.
The Entry: Rejection Near $87,000
Bitcoin had been moving strongly upward into the scheduled 6:00 PM event and was approaching the psychologically significant $87,000 area.
Earlier, I had considered placing a limit sell near $87,000, but I was mentally occupied with several other things and did not place the order.
After the event, however, I watched the market reaction.
Bitcoin pushed toward the upper area but did not establish sustained acceptance above it. Instead, I saw rejection developing and entered short manually.
The market order was filled at $86,796.5 at 6:01:47 PM.
An important distinction here is that I did not short simply because Bitcoin had reached a round number.
A level by itself is not enough.
What interests me increasingly is:
What does price do after reaching the level?
Does it accept?
Does it reject?
Does it briefly reject and then reclaim?
Does the rejection begin producing actual displacement?
These are very different market behaviors.
A Rejection Is Only the Beginning of the Question
At the moment of entry, there was no certainty that Bitcoin would begin a sustained decline.
A rejection can remain only a temporary reaction.
Price can reject an area, consolidate and then move straight back through it.
That is one reason I try not to become attached to a directional opinion simply because I have entered a trade.
The market has to continue providing evidence.
In this case, the evidence gradually became stronger.
Bitcoin failed to continue convincingly higher, and the subsequent structure began shifting downward.
Across my 1-minute and 5-minute UEI UA v1.4.7 charts, a sequence developed that included bearish counter behavior, rotations, caution states, shifts and eventually substantial downside displacement.
The market was no longer merely rejecting the $87,000 region.
It was beginning to travel away from it.
From a Tactical Short to a Larger-Move Trade
Interestingly, earlier that same day I had been discussing another way of thinking about trading.
Many of my recent Bitcoin trades have focused on capturing moves of several hundred points, often over relatively short periods.
But markets sometimes offer moves measured in thousands of points.
Those trades require a different mental framework.
If the objective is to participate in a much larger directional journey, a trader cannot expect every one-minute or five-minute movement to remain favorable throughout the entire position.
There will often be:
retracements,
counter-rotations,
temporary recoveries,
tests of previous structures,
and periods when the trade appears much less comfortable than it did moments earlier.
That does not automatically invalidate the larger thesis.
This particular trade became a useful real-world example.
From my entry near $86,796.5, Bitcoin eventually moved through several important areas, including approximately:
$86,000
$85,632 — 3rd Day High
$85,265 — Yesterday High
$84,829 — Today Open & Yesterday Close
and later toward the $83,800 region.
What began as a post-news rejection trade had transformed into something very different from an ordinary scalp.
Watching the Market Journey Through UA
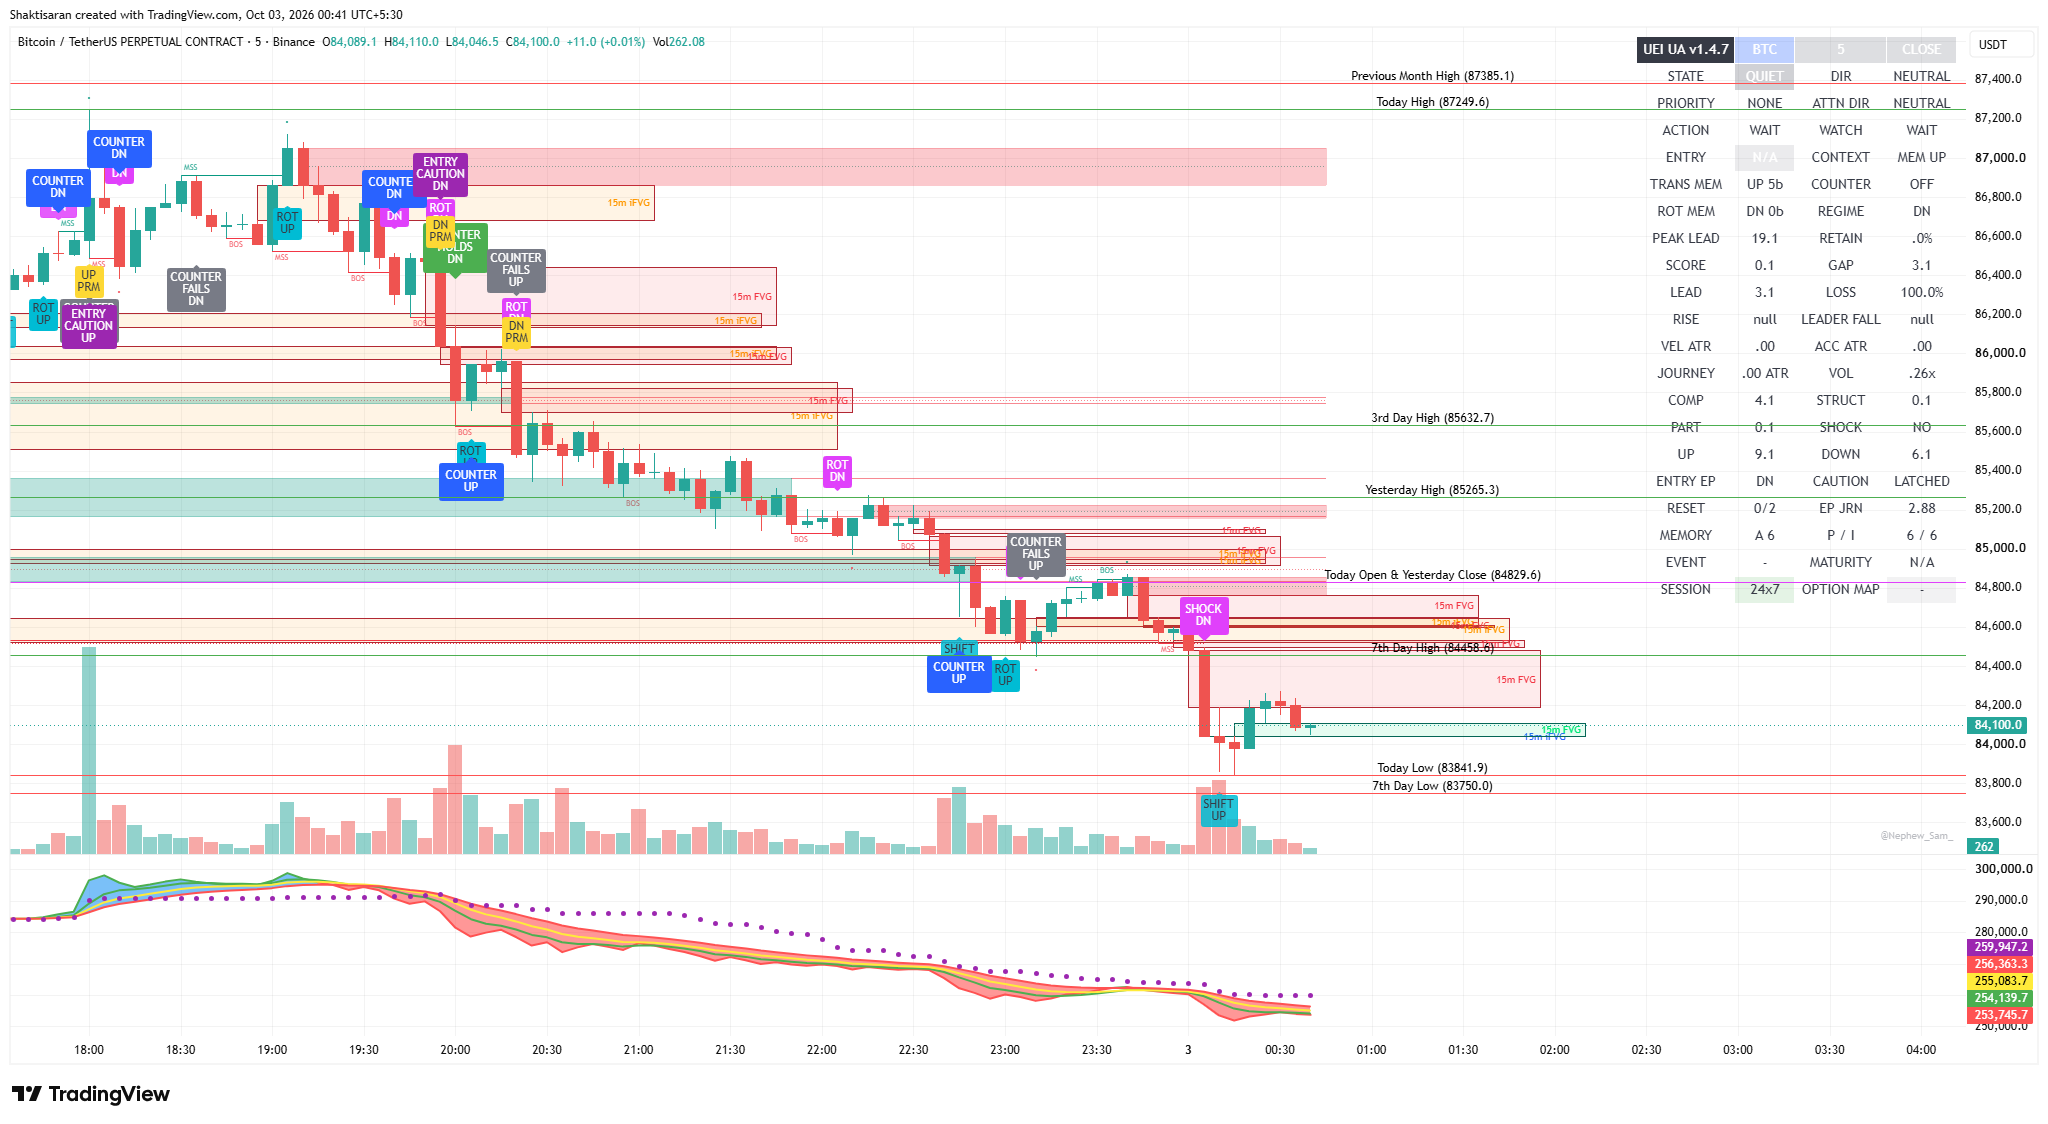
BTCUSDT 5m with UEI UA v1.4.7. The intermediate timeframe shows how the bearish journey developed through rotations, caution states, structural breaks and continued downside displacement.
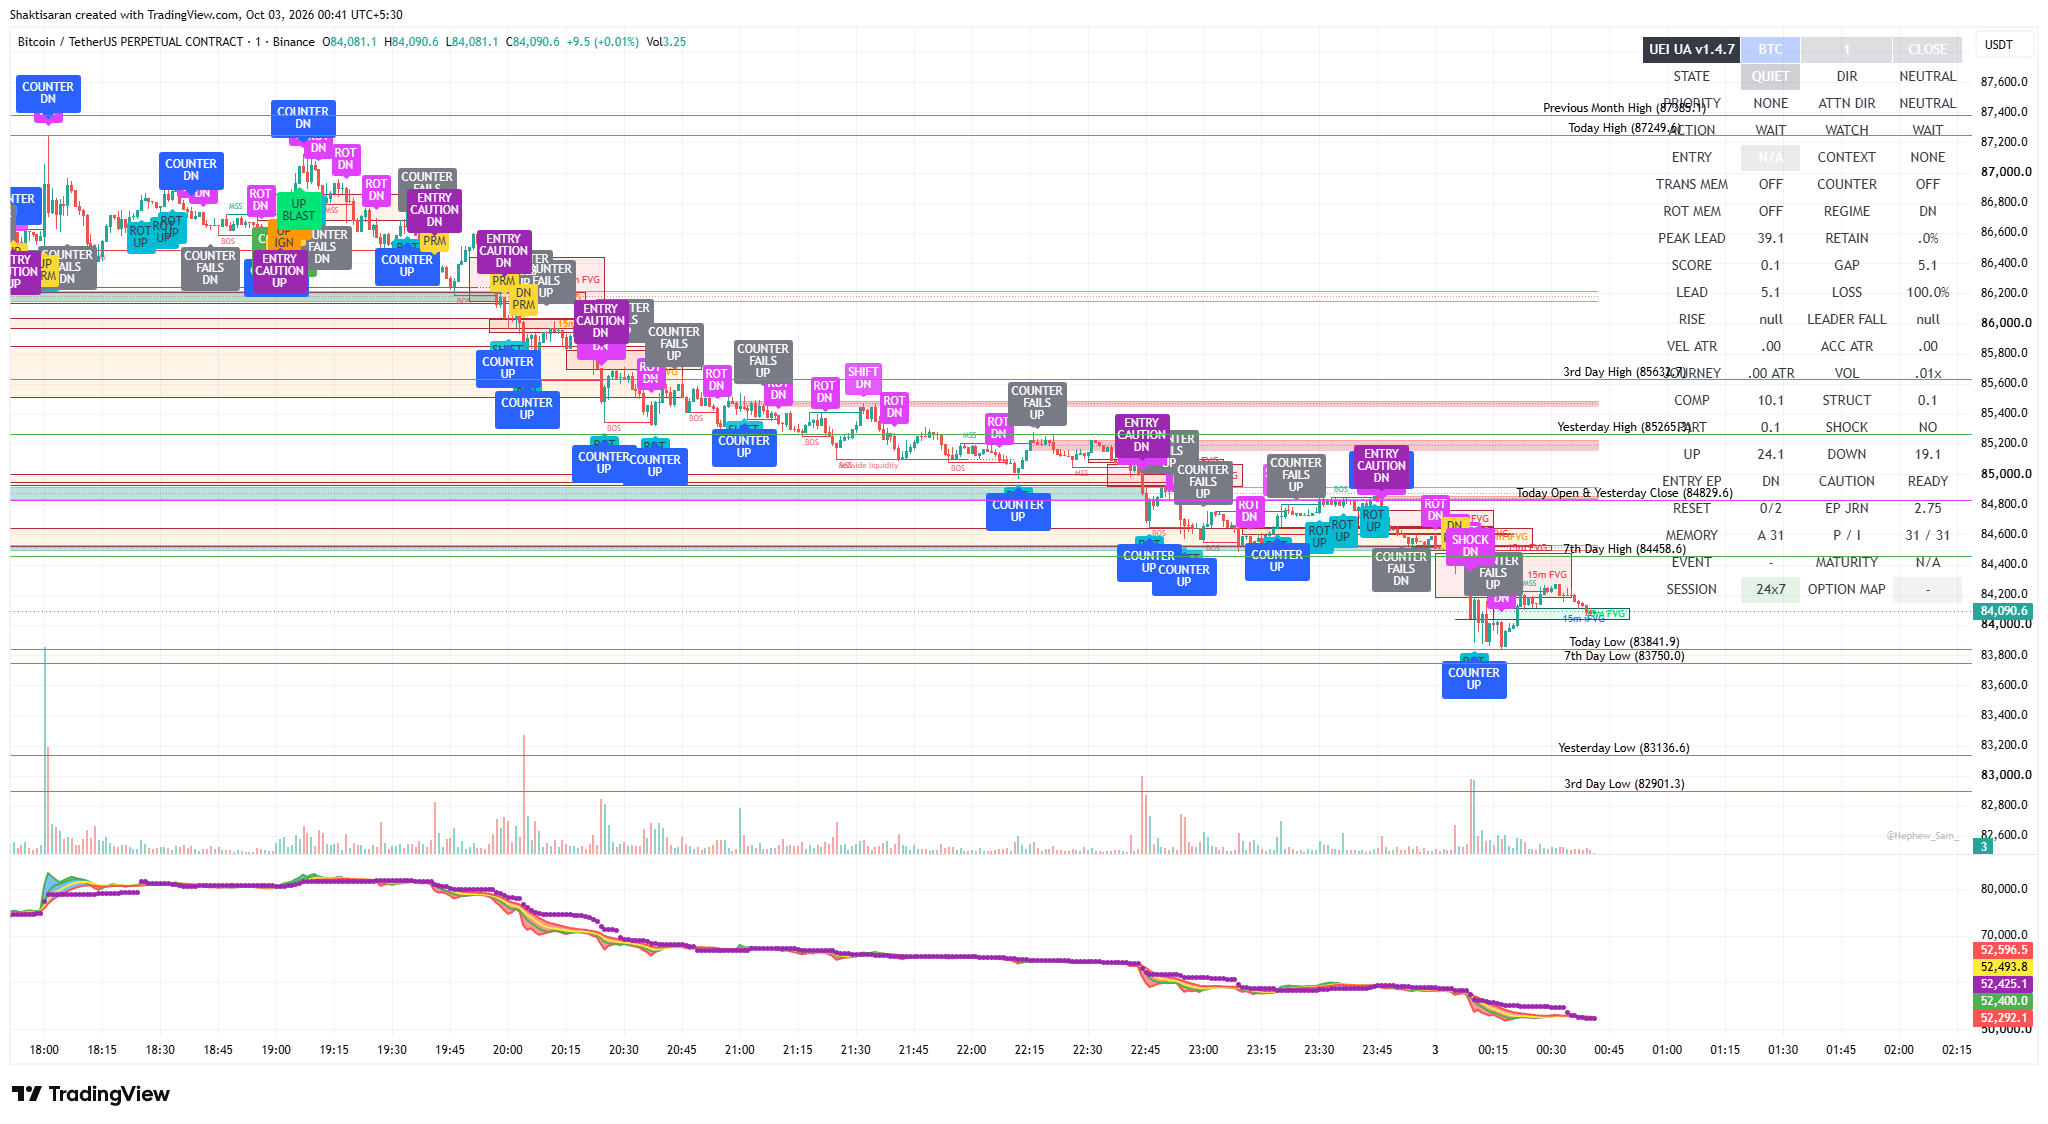
BTCUSDT 1m with UEI UA v1.4.7. The execution timeframe illustrates the considerable counter-movement and rotational activity that occurred inside the much larger bearish move.
One of the most interesting aspects of this trade was observing how UEI UA v1.4.7 behaved as the move developed.
On the lower timeframes, UA displayed a series of changing states rather than one continuous bearish message.
There were combinations such as:
COUNTER DN
ROT DN
ENTRY CAUTION DN
SHIFT DN
followed eventually by larger downside expansion.
But after substantial movement had already taken place, UA often returned toward conditions such as:
STATE: QUIET
DIR: NEUTRAL
ACTION: WAIT
That behavior is important to me.
A useful market-state engine should not continue shouting “sell” simply because price has already fallen substantially.
There is a meaningful difference between:
the start of an episode,
the active expansion phase,
and a market that has already completed a significant part of its journey.
This trade gave us another useful dataset for studying that distinction.
The 1-Hour UA Chart Brought Exceptional Clarity
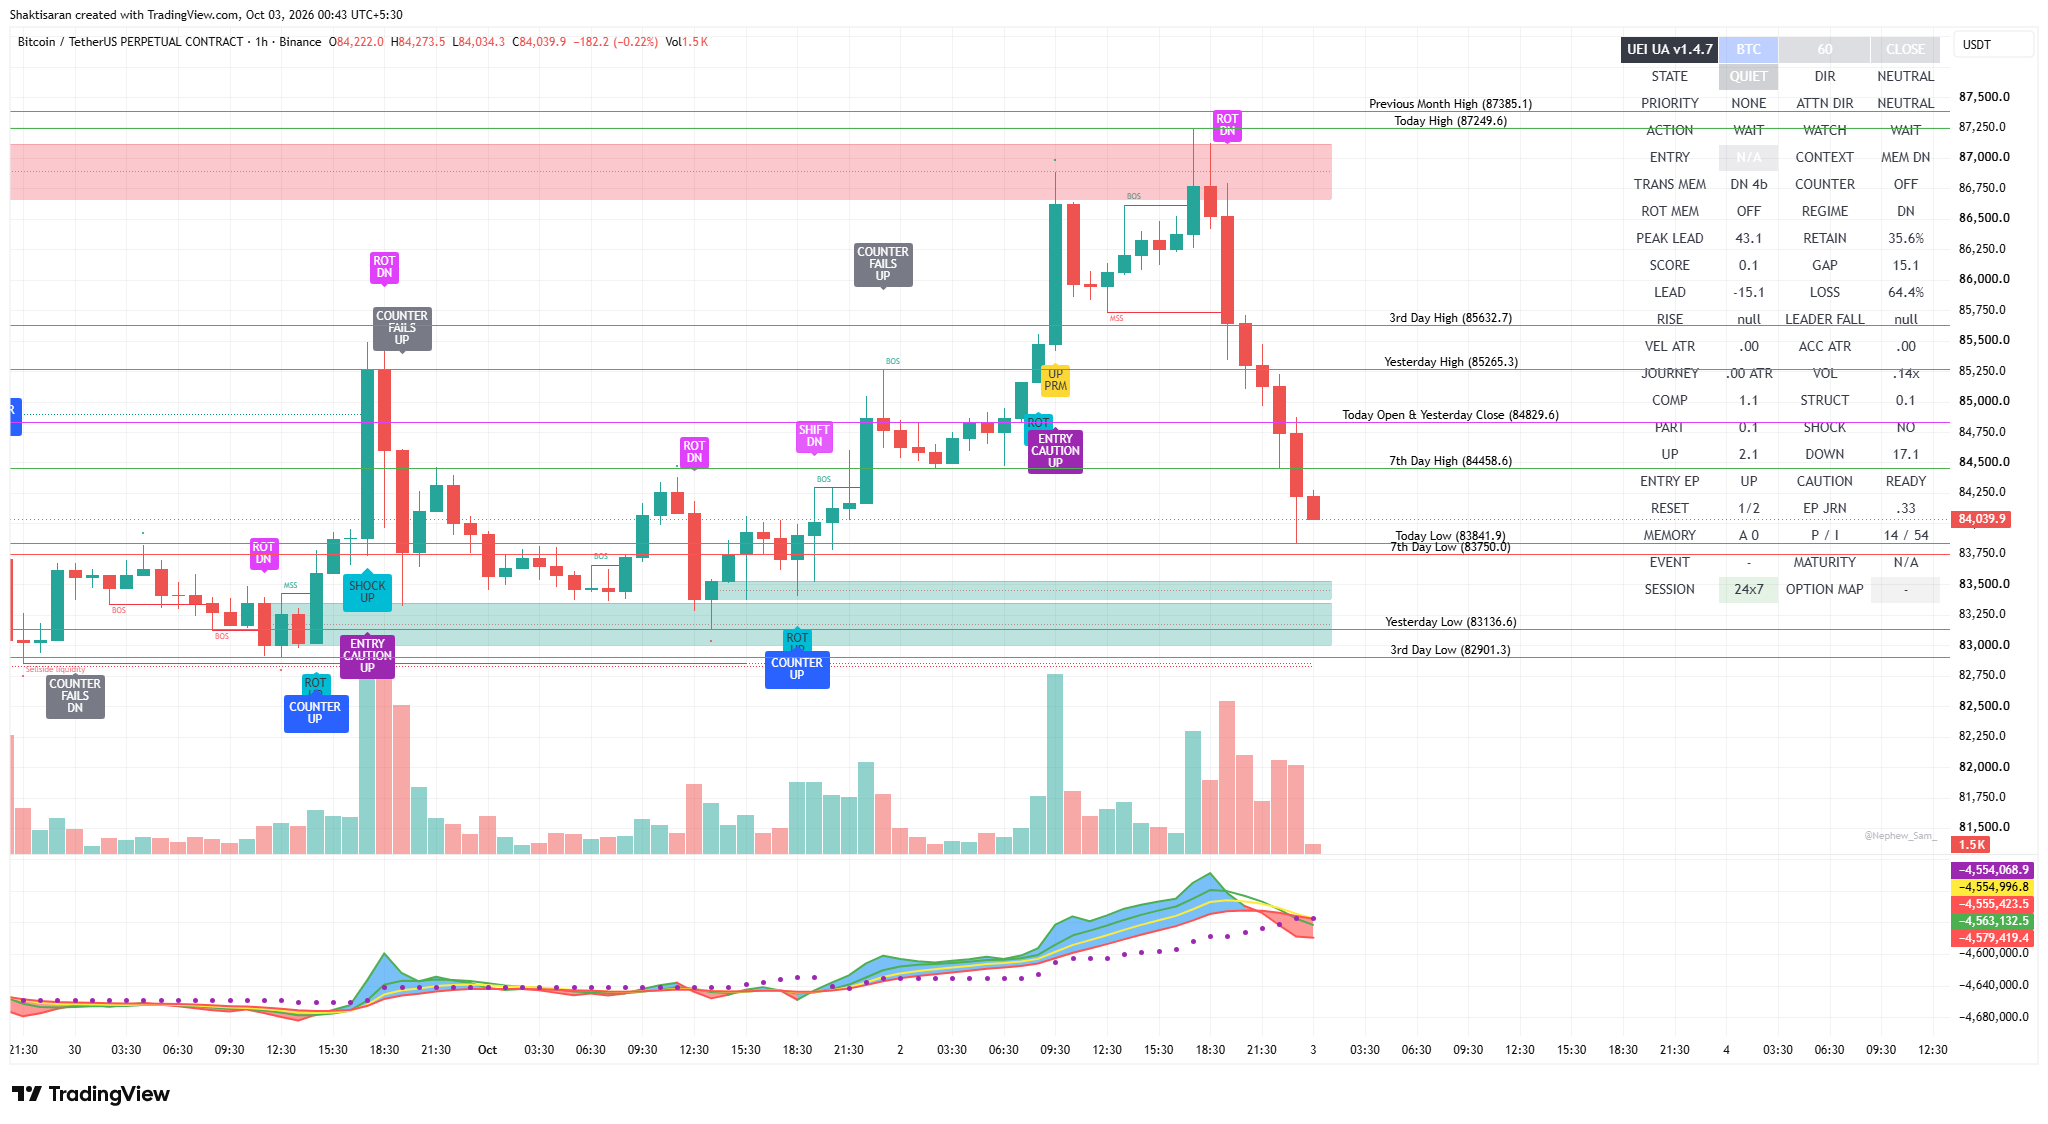
BTCUSDT 1H with UEI UA v1.4.7. The higher timeframe made the larger bearish journey particularly clear, showing the rejection near the upper region and subsequent loss of several important market reference levels.
Later, when I examined the 1-hour UA chart, the broader structure looked remarkably clear.
The lower timeframes contained many rotations and counter-movements because that is simply the nature of short-term price action.
But the 1-hour chart compressed the entire sequence into a much cleaner story:
rejection near the upper region → failure to sustain the advance → strong bearish displacement → loss of important higher-timeframe levels → continuation toward the day’s lower structure
At the time I examined it after the major decline, the 1H UA panel continued to retain bearish structural memory even though its immediate state had become quieter.
That distinction may become extremely useful in our future work.
A possible hierarchy is becoming clearer:
1H UA — larger structural or campaign context
5m UA — intermediate journey and confirmation
1m UA — execution detail and microstructure
The 1H view may therefore help prevent us from becoming excessively influenced by every lower-timeframe fluctuation while a much larger move is developing.
The Day Low and My Decision to Exit
Bitcoin eventually reached a day low around:
$83,841.9
Price then began bouncing upward.
I was away from the screen for part of this period because I had gone to get dinner and was also eating around that time.
When I returned my attention fully to the market, I considered whether the bounce might reject again around the psychologically important $84,000 region.
There was also a significant 15-minute bearish Fair Value Gap above price, so another rejection and continuation lower remained possible.
In fact, price subsequently partially entered that area and appeared to respond to it.
However, I eventually decided to close the trade at $84,117.0.
Could I theoretically have exited another 100 or 200 points lower?
Yes.
But that is not how I want to judge the quality of the trade.
Bitcoin had already produced an exceptionally large move from my entry.
It was Friday night.
A substantial part of the major directional momentum might already have occurred.
We were also approaching the weekend, when market conditions can change considerably and liquidity can behave differently.
Bitcoin could certainly continue falling during the weekend, but another possibility was that the market would slow down, consolidate or begin retracing after the large move.
Rather than demanding the absolute bottom from the market, I chose to realize what had already become a very substantial move.
And importantly, exiting did not mean I had to abandon a bearish view forever.
If another good setup develops during the weekend, I can study the market again and consider a completely new trade based on the conditions that exist then.
That is preferable to feeling that one position has to capture every remaining point.
Market Entry to Market Exit: 2,679.5 Points
The completed trade therefore became:
Market Entry: $86,796.5
Market Exit: $84,117.0
Captured Movement: 2,679.5 BTC points
This is important because these were not theoretical chart levels selected afterward.
They were my actual market execution prices.
The move was generated simply by subtracting the real exit from the real entry.
That makes this trade especially useful as a case study.
A Remarkable Personal Numerical Coincidence
There was also an unexpected personal coincidence in the final number.
The completed market journey was:
2,679.5 points
My birthday is:
26 July 1979
So seeing 2679 emerge naturally from the difference between my actual market entry and market exit immediately caught my attention.
This was especially striking to me because I have been noticing and writing about 267 and related numerical combinations for a long time, along with several other recurring numbers that have appeared in unexpectedly interesting circumstances over the years.
I do not use these numerical coincidences to determine market direction.
They are not trading signals.
They do not decide my entries, exits or position sizing.
The trade itself was based on market behavior, rejection, structure, liquidity and the information I was observing through my charts and indicators.
But as a personal observation, I found it remarkable that after more than six hours in a completely market-driven trade, the difference between the two actual executions happened to become 2,679.5 points.
Sometimes an unexpected number or coincidence can simply make us stop and look more carefully.
Entry Quality Is Not the Same as Journey Quality
This trade also reinforced something that may become increasingly important in my Unknown System research.
There may be several distinct aspects of a successful trade:
Entry Quality — Was the initial market location favorable?
Journey Quality — Did subsequent price behavior increasingly support the original thesis despite temporary counter-movement?
Expansion Quality — Once directional displacement began, how much meaningful movement remained available?
A trader can have an excellent entry but exit far too early.
A trader can also enter imperfectly but manage the subsequent journey extremely well.
And sometimes an initial trade gradually earns the right to become a much larger position or much longer-held idea as additional evidence develops.
This is one area I intend to investigate further.
Tactical Trading and Campaign Trading May Need Separate Frameworks
The experience also strengthens my belief that short tactical trades and larger campaign-style trades should not necessarily be managed using exactly the same rules.
A tactical trade may seek:
100–500 points
with relatively tight structural invalidation and a short holding period.
A larger campaign trade may seek:
1,000–3,000+ points
and therefore must tolerate more intermediate fluctuation while remaining disciplined about the higher-level thesis.
The important word is disciplined.
Holding through adverse movement must never become an excuse for uncontrolled averaging or refusing to accept invalidation.
A larger trade still needs:
a clearly defined thesis,
bounded risk,
structural invalidation,
appropriate position sizing,
and a reason for remaining in the position.
The difference is simply that the relevant structure may exist on a much larger scale.
One Trade, Many Lessons
This trade began with a rejection around a major news event.
It then developed into a sustained structural decline.
It traveled through multiple important market reference levels.
It provided a live test of the behavior of UEI UA across the 1-minute, 5-minute and 1-hour charts.
It also became a practical example of the larger-move trading concept I had been thinking about earlier that same day.
And ultimately:
Market Entry → Market Exit = 2,679.5 points
For me, the most valuable lesson is not:
“Hold every trade for thousands of points.”
That would be the wrong conclusion.
The lesson is:
Sometimes the market journey becomes much larger than the initial trade.
When that happens, the challenge is to recognize the difference between temporary noise and genuine thesis invalidation—and to keep evaluating the market rather than becoming attached either to taking profits too quickly or to holding indefinitely.
Trading is not about knowing every next candle.
It is about observing, adapting, managing risk and allowing the market itself to provide additional information as the journey develops.
And occasionally, when we look back after the trade is complete, the journey contains something unexpected as well.
In this case:
2,679.5 points.
And for me personally:
26 July 1979.
Best wishes,
Shakti Saran
— Trader Shakti
www.tradershakti.com
I am not a financial advisor or certified trading professional. Trader Shakti shares my personal trading experiences, observations and reflections for educational, informational and motivational purposes.
Disclaimer
The information provided in this article and on Trader Shakti is for educational and informational purposes only. It does not constitute financial, investment or trading advice, or a recommendation to buy, sell or hold any financial instrument or digital asset.
Any trades, market observations, strategies or examples discussed are shared only as historical or educational illustrations. They should not be considered predictions, trading signals or representations of future performance.
Past performance does not guarantee future results. Market conditions can change rapidly, and no trading method, analysis or strategy can eliminate the risk of loss.
Risk Disclaimer
Trading and investing in financial markets—including equities, cryptocurrencies, derivatives, options, futures and indices—involve substantial risk and may not be suitable for all investors.
Leveraged products can magnify both gains and losses, and in some circumstances losses may exceed the amount initially committed.
Readers should:
- Trade or invest only with risk capital they can afford to lose
- Fully understand the instruments and risks involved
- Use appropriate position sizing and risk-management techniques
- Conduct their own independent research and analysis
- Consider their financial circumstances, objectives and risk tolerance
- Seek advice from an appropriately qualified or SEBI-registered financial advisor, where applicable, before making financial or investment decisions
The website owner, author and contributors are not responsible for financial losses or other consequences arising from decisions made on the basis of information published on this website. All trading and investment decisions remain the reader’s own responsibility and are made at their own risk and discretion.