
Bitcoin had just produced a remarkably fast upward move.
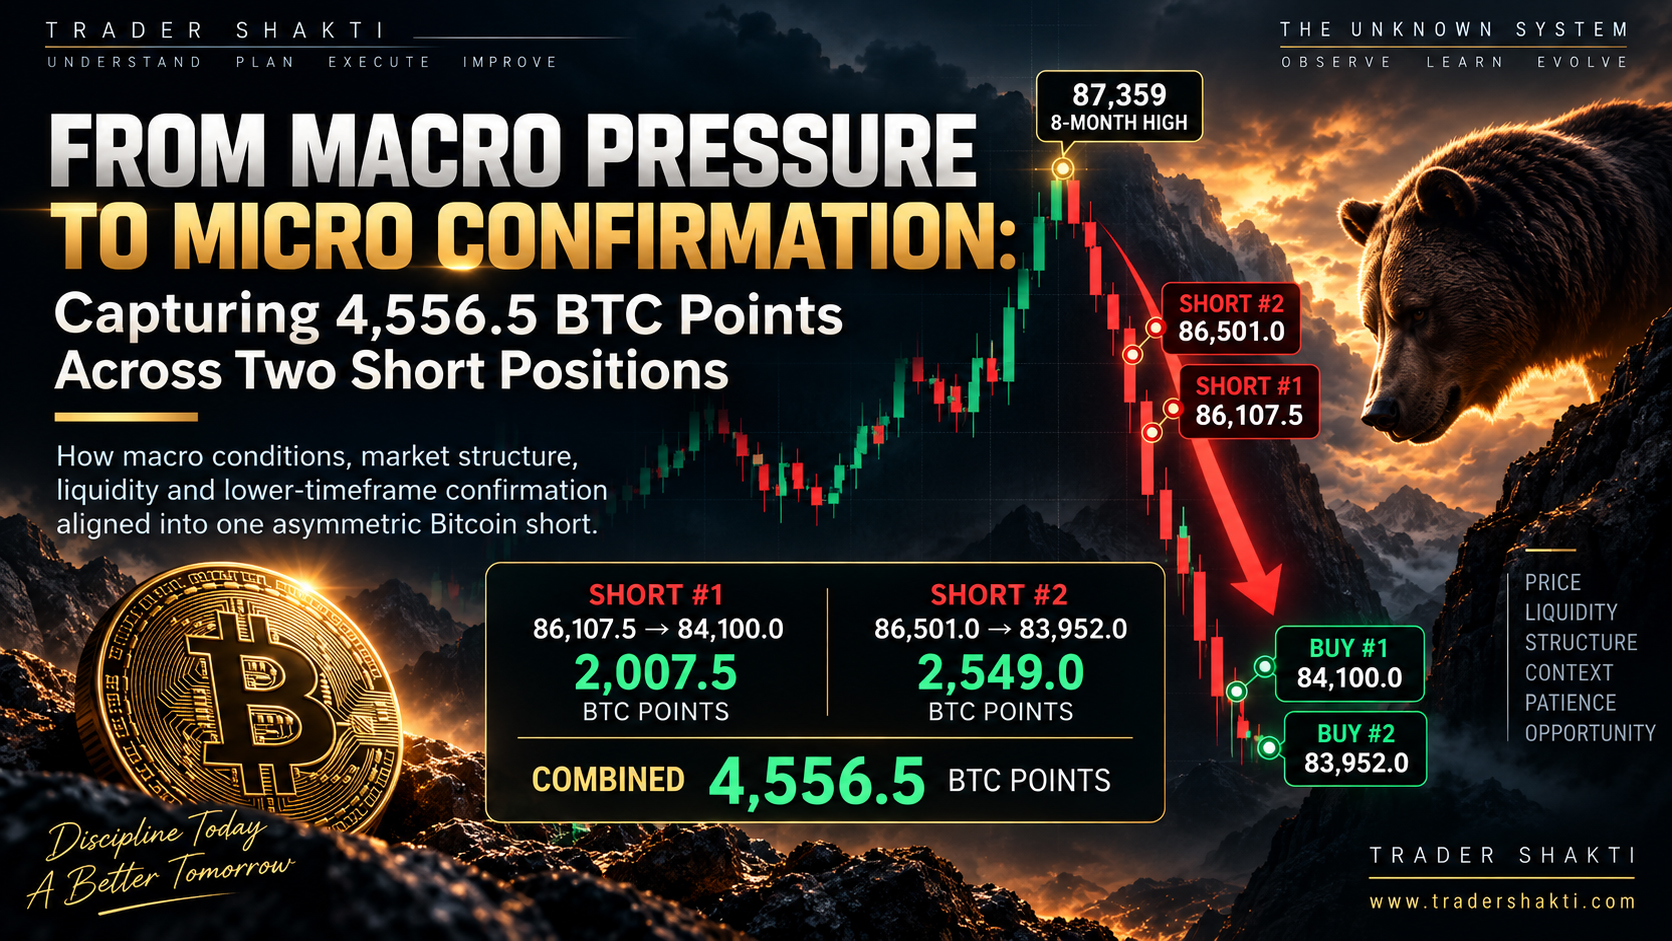
After trading around the mid-$75,000 region only days earlier, BTC accelerated above $87,000 and reached an eight-month high of approximately $87,359. The move looked powerful on the surface, and there were legitimate bullish factors behind it: U.S. spot Bitcoin ETFs had recorded approximately $999 million in net inflows in a single day, risk appetite had improved, regulatory developments were supportive and short covering had contributed to the acceleration.
But a strong price move does not automatically mean that every layer of the market is equally strong.
As I looked from the broader macro environment progressively down through Bitcoin’s higher and lower timeframes, I became increasingly interested in a different possibility:
Had BTC moved upward much faster than the broader environment could sustainably support?
I did not know that a large decline would follow.
But I saw enough evidence to begin preparing for the possibility.
And when the bullish energy visible across my charts began weakening substantially, I decided that waiting until aggressive bearish expansion was already obvious could mean entering too late and surrendering a significant part of the potential move.
That ultimately led to two separately executed BTC short positions.
The Trades
BTC Short #1
Entry: 86,107.5 Exit: 84,100.0 BTC movement captured: 2,007.5 points
Entry: September 22, 2026 — 7:21:22 PM Exit: September 23, 2026 — 7:53:17 PM
BTC Short #2
Entry: 86,501.0 Exit: 83,952.0 BTC movement captured: 2,549.0 points
Entry: September 22, 2026 — 11:00:18 PM Exit: September 23, 2026 — 7:59:47 PM
Across the two separately executed positions, that represents an aggregate:
4,556.5 BTC price points captured
The position sizes, monetary profit and account values are not important to this case study.
What matters to me is the analysis → decision → execution → outcome sequence.

Actual Trade Entry

Actual Trade Entry
A Powerful Rally — But I Wanted to Understand What Was Underneath It
It would have been easy to look at BTC breaking above $86,000 and conclude:
Bitcoin is bullish. Buy.
But that is not how I want to approach markets.
Bitcoin’s rally was real. The buying was real. ETF demand was real. The short covering was real.
The question was not whether the bullish move existed.
The question was:
Was the surrounding environment strong enough for me to assume that this rate of appreciation could continue without a substantial correction?
My answer was not sufficiently convincing.
That did not immediately make me bearish.
It made me investigate the downside more closely.
The Macro Layer
Only days earlier, on September 16, the Federal Reserve had raised the federal-funds target range by 25 basis points to 3.75%–4.00%, stating that inflation remained elevated.
The interest-rate environment was therefore hardly an uncomplicated tailwind for speculative assets.
On September 22, the U.S. Treasury’s two-year note auction cleared at 4.787%, the highest auction yield for that maturity since May 2024.
The U.S. dollar was also firm. The Dollar Index reached approximately 100.66 during the session before easing somewhat, while markets continued considering the possibility of further Federal Reserve tightening.
Richmond Fed President Tom Barkin was simultaneously emphasizing that inflation remained an important concern and defending the Fed’s recent rate increase.
None of these variables meant that Bitcoin had to fall.
That distinction is important.
Financial markets are adaptive systems. Bitcoin can rise while yields rise. It can rally with a strong dollar. Crypto-specific flows can temporarily dominate macro conditions.
And that was exactly what appeared to be happening.
BTC’s strength was actually notable because it was occurring despite some of these macro headwinds.
What concerned me was therefore not simply:
“Macro is bearish.”
It was the relationship between the layers.
BTC had moved extremely quickly, while I was not seeing a comparably powerful change in the broader global and U.S. macro environment that, in my assessment, justified assuming that such rapid appreciation could simply continue indefinitely.
Macro Created the Question — It Did Not Create the Trade
This distinction is central to how I trade.
The macro environment gave me a reason to investigate whether the rally might be vulnerable.
But I did not short Bitcoin simply because interest rates were high or the dollar was strong.
The actual entries came from much closer observation of BTC itself.
I was examining our charts across multiple timeframes, including:
market structure • liquidity • fair-value gaps • order blocks • trendlines • volume • order flow • divergences • open interest • momentum • participation • acceptance and rejection • our various trading indicators
No single indicator made the decision.
I was trying to understand the collective state of the battlefield.
Structure, Liquidity and the Battlefield
I increasingly think of financial markets in battlefield terms.
Structure is the terrain.
Liquidity is the resource.
Participation represents the fighters.
Price shows which side is actually gaining or losing territory.
Through this framework, a fast price rise is not automatically evidence that buyers will continue winning.
I want to know:
Are buyers still acquiring territory efficiently?
Are they having to expend increasingly greater effort for progressively smaller advances?
Is price entering important higher-timeframe supply?
Are bearish order blocks nearby?
Are fair-value gaps being respected or rejected?
Where is liquidity concentrated?
Are successive candles still showing convincing acceptance higher?
Are momentum and participation expanding with price—or beginning to deteriorate?
What are the lower timeframes saying inside the higher-timeframe structure?
Those questions became increasingly important as BTC moved into the $86,000–$87,000 region.
Then the Bullish Energy Began to Decline
This was the transition that mattered most to me.
The fast upward move itself did not make me short.
I watched it.
I analyzed it.
And then I began seeing the bullish energy deteriorate substantially across the charts and indicators I was monitoring.
That introduced an important execution problem.
I could wait until bearish energy became extremely aggressive.
That would give me greater confirmation.
But if the sellers did respond aggressively, the market could move hundreds or even thousands of points before a comfortable-looking short entry appeared.
In other words:
More confirmation could reduce uncertainty while simultaneously reducing opportunity.
This is something I believe deserves much more study.
The Confirmation–Opportunity Trade-Off
Traders are often told:
Wait for confirmation.
That is sensible advice—but incomplete.
Every additional unit of confirmation has a potential cost.
If I wait until everybody can clearly see that sellers have taken control, I may receive greater directional confidence but considerably worse location.
Conversely, entering too early can provide excellent location while exposing me to a hypothesis that has not yet received sufficient evidence.
The problem is therefore not:
Early entry or confirmed entry?
It is:
How much unresolved uncertainty can I rationally accept given the location, structure, potential reward, invalidation and cost of waiting?
In this case, I decided that the deterioration in bullish conditions, combined with the broader context and the multi-timeframe structure I was observing, justified establishing short exposure before waiting for the entire bearish move to reveal itself.
After entry, the next question became critical:
Would bearish energy actually respond?
If it did not, the hypothesis would need reassessment.
If it did, the market itself would progressively provide additional evidence.
Short #1 — 86,107.5
The first short was entered at:
86,107.5
I was no longer simply looking at BTC’s preceding strength.
I was looking at whether that strength was losing the ability to maintain territorial progress.
The short therefore represented a hypothesis:
Bullish expansion has deteriorated enough that downside asymmetry has become interesting, and waiting for fully developed bearish aggression may sacrifice too much of the move.
The hypothesis was not:
Bitcoin must crash.
Those are very different statements.
BTC subsequently moved lower, and I eventually closed this position at:
84,100.0
That captured:
2,007.5 BTC points.
Short #2 — 86,501.0
Several hours later, I entered another short through a separate account at:
86,501.0
Interestingly, this second entry occurred at a higher price than the first.
That is important because I was not simply chasing a falling market after seeing confirmation.
The market had given me another opportunity at a higher level while I was continuing to evaluate the evolving structure.
The second position was eventually closed at:
83,952.0
That captured:
2,549.0 BTC points.
Together:
2,007.5 + 2,549.0 = 4,556.5 BTC points.
Winning to Fight
These trades also fit an idea I have increasingly been developing:
Winning to fight rather than fighting to win.
“Fighting to win” can easily become action-first thinking.
Enter the market.
Then struggle to make the trade work.
Hope.
React.
Defend.
Instead, I want to do as much of the difficult thinking as possible before committing capital.
Understand the terrain.
Understand the participants.
Understand the resources.
Study strengths and weaknesses.
Develop possible strategies.
Identify invalidation.
Observe changing conditions.
Then decide whether the trade has earned the right to be taken.
That is what I mean by winning to fight.
It does not mean knowing that a trade will win.
No such certainty exists.
A carefully researched decision can still fail.
Unexpected information can arrive. Liquidity can behave differently. Participation can change. A technically excellent setup can lose.
So when I describe an opportunity as having appeared very high probability to me, I am describing my assessment of the evidence available before entry.
I am not describing certainty about the outcome.
The trade must first:
win the right to be taken based on the information available at the time.
Then the outcome is allowed to reveal itself.
Evidence First. Decision Second. Outcome Last.
This distinction also protects us from one of the most dangerous forms of trading hindsight.
These trades worked.
Therefore it would be easy afterward to believe:
The analysis must have been right because the trade was profitable.
That conclusion is not necessarily valid.
A poor decision can produce a profitable outcome.
A high-quality decision can produce a loss.
So I want to evaluate two different things separately:
Decision quality before the outcome
and
Outcome quality afterward.
The 4,556.5 points belong to the second category.
The macro-to-micro reasoning, structural analysis, timing, location and risk assessment belong to the first.
Only by separating them can I genuinely learn from the trade.
What the Bullish Side Was Telling Us
Another reason I consider this case interesting is that this was not an obviously weak market.
Bitcoin had reached an eight-month high around $87,359.
U.S. spot Bitcoin ETFs had just received approximately $998.95 million of net inflows—their largest single-day inflow in roughly 11 months.
Nasdaq and technology-related risk appetite had also been strong.
So the lesson cannot simply be:
BTC rallied too much, therefore short it.
Markets can remain extended far longer than seems reasonable.
The more useful lesson is:
A strong market can remain strong while the internal quality of that strength begins changing.
That transition is what interests me.
The Trade Was Not a Long-Term Bear-Market Prediction
Closing two profitable shorts does not prove that Bitcoin has entered a new long-term bear market.
Nor does the previous rally prove that Bitcoin has already begun a durable long-term bull market.
Both conclusions would require much more evidence.
There remains substantial liquidity below current prices, including areas around the high-$70,000s and approximately $75,000 that I continue to watch.
Could BTC eventually revisit those regions before establishing a more durable long-term bullish structure?
Certainly.
Could buyers instead absorb the current decline, reclaim structure and continue higher without visiting them?
Certainly.
I do not need to choose the answer in advance.
What matters is observing which scenario progressively earns more evidence.
An Interesting Thought — But Not Trading Evidence
After calculating that the two trades had captured an aggregate 4,556.5 BTC points, I noticed:
4,556.5 × 2 = 9,113
The visual resemblance naturally brought 9/11 to mind.
There is obviously nothing celebratory about that association. September 11 represents enormous human tragedy and loss.
But the number prompted another completely separate thought:
What if the market eventually travels another two or three comparable units lower?
That immediately brought the approximately $78,000 to sub-$75,000 liquidity areas back to mind.
I want to be very clear about the distinction.
The number provides absolutely no trading evidence that this will happen.
It merely generated a question.
And that, in itself, is interesting to me because it relates to a much broader research idea I call The Unknown System.
Sometimes an arbitrary observation may cause us to ask a question that we had not been actively asking.
The observation does not validate the answer.
It simply creates another direction that can be investigated.
So the process becomes:
Observation → question → independent investigation → evidence → conclusion, if justified.
Not:
Observation → significance → prediction.
For the BTC downside hypothesis, the evidence must still come from the market: macro conditions, structure, liquidity, participation, acceptance, rejection and evolving price behaviour.
In other words:
The number can generate the question. The market must answer it.
Understanding the Battlefield Before Looking for the Opportunity
This trade reinforced something that has become increasingly important in my approach.
I do not want to sit in front of Bitcoin merely asking:
Where is my next trade?
I would rather ask:
What is happening?
What is the macro environment?
Where is value?
Where is liquidity?
Where are the important structural regions?
What are buyers accomplishing?
What are sellers accomplishing?
How much effort is each side expending?
Which side is becoming more efficient?
What is changing?
And what remains uncertain?
When the battlefield becomes sufficiently understandable, opportunities tend to become easier to recognize.
That is very different from forcing a trade onto a chart.
Final Result
BTC Short #1 Entry: 86,107.5 Exit: 84,100.0 Captured: +2,007.5 points
BTC Short #2 Entry: 86,501.0 Exit: 83,952.0 Captured: +2,549.0 points
Aggregate movement captured across the two positions: +4,556.5 BTC points
The outcome was satisfying.
But the part I want to preserve is not merely the number.
It is the sequence that preceded it:
Observe → Understand → Prepare → Construct Possible Strategies → Wait → Recognize Change → Select → Execute → Reassess → Adapt → Manage → Learn
Or, more simply:
Understand first. Act when warranted. Let the outcome come later.
Right analysis. Timely execution. Meaningful moves.
Best wishes,
Shakti Saran
— Trader Shakti
www.tradershakti.com
I am not a financial advisor or certified trading professional. Trader Shakti shares my personal trading experiences, observations and reflections for educational, informational and motivational purposes.
Disclaimer
The information provided in this article and on Trader Shakti is for educational and informational purposes only. It does not constitute financial, investment or trading advice, or a recommendation to buy, sell or hold any financial instrument or digital asset.
Any trades, market observations, strategies or examples discussed are shared only as historical or educational illustrations. They should not be considered predictions, trading signals or representations of future performance.
Past performance does not guarantee future results. Market conditions can change rapidly, and no trading method, analysis or strategy can eliminate the risk of loss.
Risk Disclaimer
Trading and investing in financial markets—including equities, cryptocurrencies, derivatives, options, futures and indices—involve substantial risk and may not be suitable for all investors.
Leveraged products can magnify both gains and losses, and in some circumstances losses may exceed the amount initially committed.
Readers should:
- Trade or invest only with risk capital they can afford to lose
- Fully understand the instruments and risks involved
- Use appropriate position sizing and risk-management techniques
- Conduct their own independent research and analysis
- Consider their financial circumstances, objectives and risk tolerance
- Seek advice from an appropriately qualified or SEBI-registered financial advisor, where applicable, before making financial or investment decisions
The website owner, author and contributors are not responsible for financial losses or other consequences arising from decisions made on the basis of information published on this website. All trading and investment decisions remain the reader’s own responsibility and are made at their own risk and discretion.